Quantcast
Channel: binary foray
Viewing all 76 articles
Browse latest View live

bstrings 0.9.0.0 released

$
0
0
A few minor changes based on feedback and wiring up final options.

NEW: More RegEx patterns
NEW: Show RegEx descriptions vs the pattern for -p
NEW: Show the RegEx pattern being used in output
NEW: Save to option now works (-o). Only the search hits will be saved to the file, not what is shown on the console.

CHANGE: When using --ls, make the search case insensitive

This program is open source. The code is available here.

Benchmarks

I also did some quick benchmarks against a 6 MB Registry hive using Sysinternals strings.exe. The benchmark was recorded via PowerShell's Measure-Command function.

bstrings TotalSeconds                         : 10.0237084
Sysinternals strings TotalSeconds       : 40.2289262

Based on these numbers, bstrings is ~75% faster than strings.

Changes overview

Added some more RegEx patterns


Here is an example of the GUID regex option


General string searches are no longer case sensitive.


The -o option now works as well.


Only the hits are saved to the target file. If you want all of the console output, use redirection.


If you come up with any cool regex patterns or have any other ideas to improve bstrings, please let me know!

The latest version is available here.

bstrings 0.9.5.0 released

$
0
0
Changes include:

NEW: Added xml regex. Also matches HTML tags
NEW: Large file support added
NEW: Added -q switch. When present, only strings will be shown (header and summary are suppressed)
NEW: Add command line used to header output
NEW: Added -b switch. This lets you choose the chunk size for large files. Default is 512 MB
NEW: Add total time elapsed and averages to search summary

Here we see the new command line args, -q and -b


The command line used is now included in the output below the version and author information.


The -b switch lets you choose a block size between 1 and 1024 megabytes. Here a block size of 491 MB is used.


The xml regex option finds xml/html tags


If we run the same search with the -q option, only the matches are returned.


Final thoughts

One thing to keep in mind is that when the string count is being reported in the initial search, it is the total number of strings found in a file and NOT the total number of strings that match the --lr or --ls option.

The other thing to keep in mind is that all strings are trimmed for white space (both before and after the string). In the examples below you can see the empty string being removed in the final count (238,155 found including "", but 238,154 strings are actually displayed).

I did some testing with different block sizes to see if there was any changes in processing speed or results. I used block sizes of 152, 256, and 512 MB. The summaries are below.


As usual, get it here.

AmcacheParser: Reducing the noise, finding the signal

$
0
0
NOTE: I just pushed 0.0.5.2 out with the following changes:

NEW: Added FileExtension column to FileEntry to allow for easier sorting/filtering of results by file type

FIX: Add date formatting to created, modified, and compile timestamps

Original post below.

I recently asked about what plugins people wanted for Registry Explorer and someone mentioned Amcache, so I started looking into it.

Loading an Amcache.hve hive from a Windows 10 machine into Registry Explorer, we can see the following layout:


In doing some background research, I found a few resources such as this and this. Additionally, Yogesh and Willi Ballenthin wrote parsers for amcache. In both cases, the parsers only look at things in the Files key/subkeys.

While I do not have access to Encase, I did run Willi's script against several hives. This resulted in up to 16,000 entries in the output, most of which were DLLs. With so much information present in the output, it becomes hard to find the "important" stuff, at least at first glance.

As the blog posts referenced above mention in both their contents and comments, the Programs subkeys contain information about installed applications.

Before getting into the particulars, lets step back and look at a File entry and a Program Entry.


First, a Program Entry


Here we see the values for the selected key. My research into the keys essentially matched up with what Yogesh found in part 2 of his amcache posts with a few exceptions:

  • Values with value name b can be an Epoch date
  • Found a few additional value data entries for value name 6

My list ended up looking like this (left of equals is value name, right is description):

  • 0 = Program name
  • 1 = Program version
  • 10 = Unknown GUID
  • 11 = GUID in Uninstall Registry key (value 7)
  • 12 = Unknown GUID (same as 10?)
  • 13 = Unknown DWORD (always 0 in testing)
  • 14 = Unknown DWORD (always 0 in testing)
  • 15 = Unknown DWORD (always 0 in testing)
  • 16 = RegBinary containing some kind of program ID. 0000da39a3ee5e6b4b0d3255bfef95601890afd80709 is always present
  • 17 = QWord, always 2814749767116800 in testing
  • 18 = DWord, always 0 or 1 in testing
  • 2 = Vendor name
  • 3 = Locale ID (Language code)
  • 5 = DWord, always 1, 16, or 257 in testing
  • 6 = InstallSource? Always Msi, AddRemoveProgram, or AddRemoveProgramPerUser in testing
  • 7 = Uninstall Registry key
  • a = Epoch date
  • b = Epoch date
  • d = List of paths (not always present)
  • f = GUID in Uninstall Registry key (value 7)
  • Files = List of Root\File entries. Space separated, then @ separates File GUID from File key name

Based on Yogesh's work I will update my unknowns with what he has found.


We will look at a File Entry next


Here we can see a few subkeys of Volume IDs and the corresponding values for the selected key.

The 15 value is important as it is the full path to the executable that was run. The 101 value is the SHA-1 (with 4 extra 0's at the front for some reason) of the executable. Finally the 100 value is the Program ID that may correspond to a Program Entry. We will see how this can be leveraged soon.

Most File Entry keys have five or so values in them, but some have more, like this:


In the above example we can get a lot more information about things. Some of the values here, while having different names than what we saw in Program Entries, are used for the same purpose (version number, etc). We also get additional info in these cases like created, modified, and access dates.

Next steps

After exploring an amcache.hve file a bit, I decided to see if it would be possible to use the information available in the Programs subkeys to categorize Files Entries into two categories: those belonging to a Program Entry and Uncategorized.

So the first step in my amcache parser is to look at every Program Entry and create an object for it. These objects are then stored in a list.

The next step is to then go through each File Entry, create an object, and use the File Entry's 100 value to find a corresponding Program Entry. If a Program Entry is found, the File Entry is added to the Program Entry's Files list. If a Program Entry is not found, the File Entry is added to an Uncategorized list.

At the end of this process we are left with two things:
  1. A list of all Program Entries. Each Program Entry contains a list of its related File Entries
  2. A list of all File Entries that could not be related to a Program Entry
Now that we have things organized, we can start processing the data in meaningful ways.

AmcacheParser in action


AmcacheParser.exe is a command line tool with the following options:


At a minimum, the -f and -s switches are required. When using just the defaults, only the unassociated File Entries are exported.


This command results in a file named '20150731144524_AmcacheWin10_Unassociated file entries.tsv' being generated. The first part is a timestamp based on when the command was run, the second is taken from the name of the hive from the -f switch, and finally, the kind of file entries it contains.

Opening 20150731144524_AmcacheWin10_Unassociated file entries.tsv in Excel we can see the following (partial) output:


Notice in the output from the command above there were 16,443 total File Entries, but only 243 unassociated entries.

In my experience (with the exception of a few Adobe products), malware does not come with a nice installer. As such, we can, in almost every case, ignore the file entries that are related to program entries, at least initially.

By approaching things in this manner, we are able to reduce the amount of data we need to look at by over 98.5%!

Of course if you want to see ALL file entries you can. Just use the -i switch, as such:


This results in three files being generated, as seen below


The Associated and Unassociated files have the same layout with a single difference. The first column in the associated list will contain the program name it is associated with (Git version 1.9.5-preview20150319 or DisplayFusion 7.2 (Beta 9) for example)

Finally, a file containing all the Program entries is saved (again, this is partial output).


But can we do better?

The astute observer may have noticed a few additional command line options, namely the -w and -b switches.

These switches allow for whitelisting or blacklisting file entries based on SHA-1 hash.

For example, consider the screenshot below, which contains a section of the unassociated file entries we saw above.


Since I strip off the extra zeros at the front of the hash when exporting data, we can use the output from AmcacheParser to feed our white and black lists.  Of course you can also use any means you want to generate a text file containing SHA-1 hash values (like my hasher program) as well. 

If we copy the hashes above and put them into a text file (one per line), we can then feed this into the parser.


Now we are down to 192 unassociated entries, from our initial 243. 

The percentage is based on the total number of file entries, so the more comprehensive your white list is (take all dll's and exe's from a known good host/baselined system for example), the better. Using this technique would allow you (if you wanted to) hide all standard Windows executables and so on.

In 5 minutes I was able to generate a decent whitelist file for testing that eliminated more than 80% of the unassociated entries and even more of the associated entries.


The flip side of whitelisting is blacklisting. This is useful once you have identified evil and want to quickly find it elsewhere.

Let's say the following items are evil:


If we add those to a text file, we can do something like this:


Conclusion

I have tested the parser against hives from Windows 8.0, Windows 8.1, and Windows 10 successfully. The program should gracefully handle errors processing individual Program and File entries and inform you of any issues on the console. 

If you do run into any errors, please send me the hives or at least the output from the screen.

One other idea I had (and I am interested in feedback) is to come up with a way to weigh entries in the unassociated list. For example, if the parser sees 'temp' in the full path, its score would be increased, and so on.

If there are any other features you would like to see included in AmcacheParser, please let me know!

AmcacheParser is now available from the usual place and the source is available on GitHub.

A few updates

$
0
0

ShellBags Explorer/SBECmd

This is a highly recommended update as it fixes a lot of fringe cases and greatly improves XP support.

NEW: Updated controls
NEW: Open hives via right click | Open or as an external application from programs like X-Ways, etc.
NEW: Detect if .net 4.6 is installed
NEW: A bunch of new GUIDs
NEW: Support additional type IDs in XP hives
NEW: Added support for Beef0005 extension blocks (which contain multiple shell items and extension blocks themselves)
NEW: Handle lots of other fringe things
NEW: CTRL-C copies selected bytes to clipboard in Hex view

CHANGE: Show version # in title bar
CHANGE: Add fallback search for BagMRU key if standard ones arent found
CHANGE: Save/restore width of tree

FIX: Handle more types of zip file contents in XP hives
FIX: Correct issue showing Last Access time from zip file contents.
FIX: Handle Unicode better in CDBURN shell bags
FIX: Handle Unicode better in directory shell bags

bstrings

NEW: Detect .net 4.6 on start up. Exit if not found.

CHANGE: Display any error messsages on cmdline vs just showing help
CHANGE: check for errors in regex pattern before opening file, catch bad regex patterns up front


What's next?


The next big release will be Registry Explorer and support for plug-ins.


As usual, hit up the links here to get the latest

Registry hive basics part 5: Lists

$
0
0

Recap

This is most likely the last of the Registry hive basics post. If you missed any of the previous ones, here they are:

It is recommended to read through those posts in order before reading this one.

Before getting into the various list structures, lets take a step back to look at the overall structure of the Registry.

A hive is made up of a header followed by multiple hbin records. Inside each hbin record are cell records, list records, and data records. 

Cell records would include NK, VK, and SK records.

List records would be things like li, ri, and db records (more on this later).

Data records are used to store things like a value's data.

This structure can be summarized as follows.


While the hbin records shown above look to be the same size, there is no requirement that they be the same. hbin records only have to be a multiple of 4096 bytes. 

It helps to think of the hbins as containers for various record types. There is NO relationship between records based on their positions inside hbin records. The glue that holds the Registry together are the different types of list records which this post will cover in detail.

The general rules for parsing a hive can be summarized as follows:
  1. Open file
  2. Read header
    1. Get RootCellOffset
    2. Get length
  3. Locate hbin
    1. Determine length of hbin
  4. Find records in hbin
    1. Cells
    2. Lists
    3. Data
  5. "Do stuff" with records
  6. GOTO 3 until Length (Step 2.2) is reached
  7. Close file
The starting point would be the NK record at RootCellOffset (Step 2.1). See here for details on how to find the RootCellOffset. From here you can start walking the tree of keys and their related values and security records.

Lets take a look at a root cell as a frame of reference we can use for the rest of the discussion.


At the bottom of image we can see the raw hex that makes up the root cell.

Getting to values

The first list we encounter is the Value list cell index at offset 0x2C. In the above example, the value list cell index is 0x188, or 392 in decimal. This is the RELATIVE offset for where a list lives that contains the offsets to the values for this key. Since value count is equal to 1, we would need to go to offset 0x188 and read 1 offset. This offset will again be a relative offset to a VK record.

We will get into the particulars of the different kinds of lists below, but lets continue the example here. Since our value list is at relative offset 0x188, we need to add 0x1000 it to get to the absolute offset. 

If we go to 0x1188, we see the following:


The first 4 bytes are the size. This is a signed 32 bit integer. We can see that the size of the list is -8 bytes long. As we have seen before in other places, the negative size simply means the list is in use. The bytes in the rectangle make up the list we are interested in.

Once we know the size, we can move forward to the start of the offsets. In this case we are left with a single, signed 32 bit integer, 0x0170, which is equivalent to 368 in decimal.

It is not always the case that the list pointing to values will contain the same number of offsets as the total number of values in an NK record. It may very well be there are more offsets or other "stuff" after our list of offsets to VK records. This extra data would be considered slack. In short, once you have the start of a list, you should read X number of 32 bit numbers where X is the number of values related to the NK cell you started from (1 in our case).

Now that we have the offset to where the VK record lives, we can now get the bytes that make up the VK record.

Below we can see what the value at relative offset 368 (0x170) looks like.


In most cases, values will not use lists, but there are some cases where we will need to deal with lists when processing VK records (the big data case).

Getting to subkeys

The next list we run into is the Subkey list stable cell index found at offset 0x20. In our example above, it lives at relative offset 0x4B7020 (4943904 in decimal).

If we add 0x1000 to 0x4B7020 and go to that offset, we see the following monster:


We can see the total size of the list, -2520 bytes (highlighted in blue). This list now works the same as we saw. In the NK record screenshot above, we see there are 256 subkeys under the root key. This can be found in the Subkey count stable field at offset 0x18.

This list however, is different from the one we saw before. Notice directly after the size we can see a signature 'lf' in the data. This is a specific kind of list (which we will again drill down into below), but for now trust me in that we have to skip another 4 bytes to get to the start of our offsets.

Once at the start of the offsets, each offset is 8 bytes long. The first four bytes are the offset to an NK record and the last 4 bytes are the first 4 characters of the subkey name.

So now that we are at the list (at offset 0x08 in the highlighted bytes above) we can now start collecting relative offsets for our subkeys. If we look at just the first few we can see the following offsets are listed:

0x0190 == 400 decimal (*)
0x04A8 == 1192 decimal (.3fr)
0x0518 == 1304 decimal (.3g2)

Now that we have a few offsets to some subkeys, we can look at them.

The hive we are working with, when loaded into Registry Explorer, looks like this:


Now lets look at the NK record that is found at relative offset 0x0190 (400 decimal):


Next, the NK record at relative offset 0x04A8 (1192 decimal):


And finally, the NK record at relative offset 0x0518 (1304 decimal):


This of course would be repeated a total of 256 times to get access to all the subkeys.

Lists

The previous section explained how lists are generally used in the Registry. As we discuss the different kinds of lists below we will not explain things again where the same pattern is used. In other words, lf and lh lists work as we saw above (go to offset, read more offsets, go to those offsets, etc), so we won't unpack that again in the lf and lh section.

There are 5 types of lists in Registry hives. The signatures for these lists are:
  • lf
  • lh
  • li
  • ri
  • db

lf and lh lists

lf and lh lists are very similar in structure. The basic structure looks like this:
  • Offset 0x00: Size (4 bytes)
  • Offset 0x04: Signature: (2 bytes)
  • Offset 0x06: Number of entries (2 bytes)
  • Offset 0x08: Offset record
    • Relative offset (4 bytes)
    • Hash (4 bytes)
  • ...
where ... is a continuation of the offset structure, typically "Number of entries" long

The difference between the lf and lh lists is the format of the Hash.

In lf lists, the hash is the first 4 characters of the key name. 
In lh lists, the hash is numerical and is simply an unsigned 32 bit integer.

The numerical hash basically works as follows:
  1. First set hash value to zero 
  2. Then, working from left to right through the letters of the SubKey name, for each one, multiply Hash by 37 and then add the ASCII value of that letter 
There are a few caveats tho. For full information on how this works, see section 4.29 here.

That's pretty much it for this kind of list, but here is what an lh list looks like in its raw form (not the whole thing, but you get the idea). This particular list has 506 offsets in it.


li and ri lists

li and ri lists are very simple. The structure looks like this:
  • Offset 0x00: Size (4 bytes)
  • Offset 0x04: Signature: (2 bytes)
  • Offset 0x06: Number of entries (2 bytes)
  • Offset 0x08: Offset record
    • Relative offset (4 bytes)
  • ...
where ... is a continuation of the offset structure, typically "Number of entries" long

Here is an example of an li list. 


Here is an example of an ri list.


For the ri list, the size is -16 bytes. At offset 0x04 is the signature. At offset 0x06 is the number of entries, 2.

Starting at offset 0x8, we see the 2 offsets:

0x717020
0x72F020

ri lists are different in that their offsets do not directly point to NK records, but rather, ri lists point to other lists!

Recall from earlier that Registry hives have a version. 

li records are only found in version 1.3 hives. For v1.3 hives, ri lists point to li lists. In v1.5 hives, ri lists always point to lh records.

If we take relative offset 0x717020 from above and look at what it points to, we see this:


Can you tell what version hive this particular list came from based on the kind of list 0x717020 points to?

Once you resolve the offsets in the ri list to the lists each ri offset points to, you can now process each list to get to the related NK records.

Are we having fun yet?

db list

The final list we will discuss is the db list, also known as the big data case. A db list is used in a VK record and is used when a VK record's value data is very large (greater than 16344 bytes). db lists are only found in hives with version greater than 1.3.

The db list structure is even simpler than the other lists we have seen.
  • Offset 0x00: Size (4 bytes)
  • Offset 0x04: Signature: (2 bytes)
  • Offset 0x06: Number of offsets (2 bytes)
  • Offset 0x08: Offset to offsets
Here is an example of a db list.


In this case, starting at offset 0x08, the relative offset to offsets is 0x078F30. If we add 0x1000 to this and look at it, we see this:


In the example above, after skipping the bytes that make up the size (-16), we get 2 relative offsets:

0x07B020
0x07F020

These offsets contain the data for a VK record.

With these offsets in hand, we can now read each offset in turn and concatenate the bytes found at each offset together to reassemble our complete VK value data.

Each offset will point to a data record which is simply a size (32 bit signed int) followed by the data we are interested in.

The beginning of the data (length is -16352) at relative offset 0x07B020 looks like this:


The END of the data at relative offset 0x07B020 looks like this:


(This will become relevant in a second)

The beginning of the data (length is also -16352) at relative offset 0x07F020 looks like this:


What you should notice here is that the data at the end if our first offset (0x07B020) is continued immediately in our second offset (0x07F020) after the length of the data cell.

This process is continued for each offset. Once that process is done, you have your big data value as is shown below:


Note that both of our data records have size 16,352. If we take away the 4 bytes for the size, that leaves us 16,348. Since we have 2 of them, that makes 32,696 total bytes. Like every other VK record, we do not necessarily need all that data. Once the data is reassembled, you have to then honor the VK record's data length property (offset 0x08). In our example, the data length is 0x7D4C, or 32,076 in decimal, bytes. That leaves a difference of 620 bytes, which is a combination of value slack and padding.

Earlier we said that db records are only found in hives with version greater than 1.3. Looking at the hive properties where the above value is, we can see that the version number is 1.5.


That's about it for lists and the Registry basics series. I hope you found it interesting. If there are any other topics you would like to see discussed, please hit me up in the usual places and let me know.


bstrings 0.9.7.0 released

$
0
0
Not a lot of changes, but important ones.

Changes include:

NEW: Added some new Regex (sid, windows path, variable set, registry hive paths, base64 strings) with thanks to James Habben
NEW: Add detection of strings split across chunk boundaries
NEW: Added -d switch to recursively search a directory (per a request from David Cowen)

I am also working on porting James SQLite code which I hope to have in the next release.

And now, on to what these changes look like.


Here we can see the new command line option, -d, and a note at the bottom that either -d or -f is required. This lets you target a single file or an entire directory of files (and other directories) to extract strings from.

When using -d, bstrings will search each file and show the results of each search. To combine all the search hits across all the files, use the -o switch.


An interesting (and possibly problematic issue) is when strings get split across a chunk boundary. By default bstrings searches in chunks of 512 MB, but this is user definable. In previous versions of bstrings, a string across a chunk boundary would not be completely found. Rather, only the beginning and end of the string (separated at the boundary) would be reported.

In order to address this, bstrings now does some checking at each boundary to look for complete strings. In the example above, notice how we have strings like segment1, segment2, zimmerman, and so on. If we change the chunk size to, say, 1 MB, we get different results that look like this (I stripped out the middle part of all the Chunk processing to keep it simple):


As you can see, several of the words we found using the defaults are now split up, but with the new boundary checks, we are getting the additional strings as well. When a string is found at a boundary, it is prefixed with two spaces.

If the same command as above is run, but with a chunk size of 4, we get different results, like this:


Notice now how the initial strings look different, but in the end we still get the same strings out of our file.

The way it works under the covers is to use a sliding scale depending on what the minimum size string is set to. bstrings will move back '20 times the minimum length' bytes, then grabs twice this amount of bytes to look for strings. This way, as your minimums get longer, the amount of bytes that are checked also gets longer.

Let me know if there is anything else you want added and I can get it on the TODO!

As usual, you can get the update here or on Github.

bstrings 0.9.8.0 released

$
0
0
Last week, the esteemed David Cowen @HECFBlog reported a bug when using the -d option I recently added.

Specifically, he reported an error related to long file names:


So I created some long file paths, added a fix, and then did some testing.

Here is the before and after:


So now you should be able to search arbitrary data for strings regardless of how crazy the paths get!

Get it here or on GitHub.


XWFIM version 1.5 available!

$
0
0
I am happy to announce the availability of XWFIM v1.5. This is a complete rewrite which was done for several reasons including moving to C# and restructuring things in such a way to make future updates much easier (interfaces, removing duplicated code, etc).

NOTE: IF YOU SEE THIS


INSTALL .NET 4.6. There is nothing I can do to gracefully catch this error,

The first time you start XWFIM you will be prompted to provide credentials.


This version now supports dongle and BYOD versions of X-Ways Forensics as well as Investigator and Imager.


Once at least one set of credentials is entered, installation is possible.

The Install type radio button will change depending in what credentials were entered.


As you can see, the interface has been streamlined and unnecessary options were removed such as whether or not to install the viewer component. Additionally, the validation option has been removed from the main window and moved to its own form under the Tools menu.

The status messages have also been improved to show you the last time X-Ways was modified, both locally and on the remote server.

Other new features:

  • Bookmarks menu added to main menu
  • Validation log is now Excel based vs a text file
  • Support for Imager added
  • Ability to create WinHex shortcuts
  • Shortcuts are automatically set to 'Run as administrator' when created
  • Shortcuts now include the version of X-Ways the shortcut points to. This allows for using XWFIM to install multiple versions of X-Ways (when 'Append version #' is checked)
  • Create portable installation updated to support newer versions of X-Ways (2 hash databases, change to location of external editor, etc)
  • XWFIM will now detect what has been installed in the last directory used. For example, if Forensics is installed in c:\xwf and then the install type is changed to Imager, a warning will be displayed in the status messages indicating this so you to not overwrite your current installation inadvertently


and a lot more!

Because this is a new version, older versions will NOT auto update. You can get this version manually here.

Enjoy!

Registry Explorer plugin overview

$
0
0
On this post, Ashraf H commented:

It would nice if we have "Hex viewer", next to "Type viewer" for values, where we can quickly check raw binary data for values and open "Data Interpreter". Now I can only open "Data Interpreter" for values for type binary.
I was checking "ControlSet001\Control\TimeZoneInformation" key in SYSTEM hive, "ActiveTimeBias", "Bias" and "DaylightBias" values of type RegDword are stored as signed integer, but they are interpreted by regedit and Registry Explorer as unsigned integers. I had to open "Technical Details" for "TimeZoneInformation" key, go to Values, click on "DaylightBias" and then move to "Value data" and copy value data to external data interpreter "FFFFFFC4" (LE) to know the right value "-60".

 The key in question, ControlSet001\Control\TimeZoneInformation, looks like this:


Here we can see the different values as Ashraf mentioned. The DWORD values are being interpreted by every Registry viewer I tried as unsigned ints, but if we treat them as signed ints, we can get different information, like RegRipper does:


Notice here how we have the Bias and ActiveTimeBias and both are negative. Additionally we can also see the time zone names have been displayed in the same way they are shown in the values above.

This kind of functionality is a perfect candidate for a plugin in Registry Explorer, so I started looking into the values in the TimeZoneInformation key. Most are straightforward but two of them are a bit more strange, StandardStart and DaylightStart. Both are REG_BINARY values whose data looks similar to this:
00 00 0A 00 05 00 03 00 00 00 00 00 00 00 00 00
X-Ways Forensics has an extensive time zone database in it and if we look at the values for UTC-1, it looks like this:


We can see in the binary data 0x0A, which is 10 in decimal. This seems to correspond with the month for daylight end (the corresponding value in the Registry would be StandardStart). Additionally, we can see a 3 and a 5 in the binary data from the StandardStart value.

To confirm this, I looked for time zones in X-Ways that used more of the fields, specifically the 'day of week' value. I settled on two time zones, UTC-3 Greenland and UTC-4 Santiago.

X-Ways defines UTC-3 as follows:


And a Registry viewer shows this:


From what I have been able to tell, this breaks down as follows:
start00 00 03 00 05 00 16 00 00 00 00 00 00 00 06 00
hour22
day of week6
week of month5
month3
00 00
03 Month
00
05 week of month
00
16 == 22 decimalhour
00
00 minute
00
00 second
00
00 00 millisecond?
06 00day of week

 When the same thing is done with UTC-4, it looks like this:

start00 00 0A 00 02 00 17 00 3B 00 3B 00 E7 03 06 00
hour24
day of week6
week of month2
month10
00 00
0A == 10Month
00
02 week of month
00
17 == 23hour
00
3B == 59minute
00
3B == 59second
00
E7 03 == 999millisecond?
06 00day of week

Notice in that last example, for whatever reason, Microsoft is using essentially as close as they can to 24 (23 hours, 59 minutes, 59 seconds, and 999 milliseconds) and this corresponds to within 1 millisecond of what X-Ways shows for UTC-4:


Here is another example showing the relationship between the value data and X-Ways:


With this information in hand, a new plugin was written: TimeZoneInformation.

First, we can of course see the raw values in Registry Explorer by clicking on the corresponding key:


Now that we have a plugin that is interested in this key however, notice we get a new tab that contains far more useful information for us.


Here we can see not only the information we saw in RegRipper, but every other value as well including our newly decoded StandardStart and DaylightStart values.

While this will most likely never be the key to break a case, we now have some insight into how Microsoft is storing time zone information and how that data relates to our forensic tools.

This is merely one example of the powerful capabilities of plugins for Registry Explorer. Here are some screenshots of other plugins that are currently completed.


We have already seen the TimeZoneInformation plugin, so lets look at some others.

Recent documents


User accounts


UserAssist


AppCompatCache


As usual, the plugins are all open source and available here.

The next release of Registry Explorer should be out soon and will include these and (hopefully) more plugins. The plugins will then be used to generate reports, etc, so a lot of cool new stuff is coming!

If there are any keys/values you want to see plugins for, please let me know!!


Registry values starting with a NULL character

$
0
0
On January 19, Harlan blogged here about Registry values that start with the NULL character (00). He wrote a plugin for RegRipper to detect such keys.

After reading about it I wanted to see of my Registry code handled this case as well.

The test hive has two values located at Software\Microsoft\Windows\CurrentVersion\Run that look like this:


As you can see, there are two values in the Run key, but the names appear to have some empty space on the left side.

If we look at the Technical details for this key and click on the 'Value count' property, we see this:


So the NK record (the key) says there should be two values. So far so good!

Looking at the Values tab shows us:


I clicked on the 'Name' property on the right side and the bytes that make up the name are highlighted. As you can see, there is a NULL character at the beginning of the string.

Based on this, Registry Explorer, RECmd, and anything else that uses my Registry parsing code handles this use case with ease.

Enjoy!

Windows Prefetch parser in C#

$
0
0
I recently completed a Windows Prefetch file parser in C# that is available here.

This project will serve as the basis for a GUI and Cmd line tool similar to how ShellBags Explorer and SBECmd work.

There is a TON of data in these things and I hope this project will enable people to do more research into things to find new ways to use Prefetch files.

What do you want a Prefetch tool to do? Leave your requests in the comments or hit me up via email!

Here is an example of the kind of information that is exposed:

Introducing PECmd!

$
0
0
Here is the initial version of Prefetch Explorer Command line (PECmd), version 0.5.0.0!

Like my other command line programs, running it without arguments will display the options:


As you can see, we need to specify either -f or -d. The rest of this post will demonstrate processing a single prefetch file since the -d option essentially does the same thing for all prefetch (*.pf) files found in the given directory. Additionally, the -d option processes directories recursively.

So lets process a file!


In this example we see many of the defaults, including the keywords to highlight. We will discuss keyword highlighting below.

At the top we can see the basics like executable name, the hash, and the version of the prefetch file. Below that is the run count and last run timestamp. When more than one run date/time is found, they will be displayed as shown below.


After the last run information is the volume information sections. In most prefetch files there is only one volume as we can see above. We get information about the name of the device, when it was created, and its serial number.

In this version, timestamps are converted  to the time zone of the machine where PECmd.exe is running. The next version will have a --utc switch that will display all timestamps in UTC time.

For each volume, a listing of directories is maintained. These directories follow the volume information. We will see an example of a prefetch file with two volumes below.

Finally we see a file listing. The executable is highlighted in yellow and any keyword hits are highlighted in red.

Multiple volumes

Here we can see a prefetch file that references multiple volumes, two in this particular case.

As you can see, information is dumped about each volume, then a listing of all the directories is displayed. In the example below, notice how the last two entries (index 14 and 15) reference hard disk volume 3.

Below that is the file listing and again we can see the executable was run from volume 3 as well. We can also see some temporary files were created which are highlighted (since they contain the string 'tmp').


Looking for keywords

Next, lets take a look at how you can augment the built in keywords. The -k switch allows you to supply a comma separated list of values you want to highlight in file names and/or directories. Be sure to surround the list with double quotes.

In the example below, you can see the -k switch was used to provide two additional strings to highlight.


Exporting to json

While this version only supports exporting to json, the next version should include other export formats such as csv.

Using the --json switch followed by a directory name will export the parsed prefetch data to a json file. If the --pretty switch is used, a more human readable layout will be created. If you plan on ingesting the json data into other programs, it is recommended to not use the --pretty switch.

When the -d switch is used with --json, each processed file will be saved to a unique filename in the directory specified.

In the example below we are exporting json data to c:\temp which is then reflected at the end of processing (highlighted with a red outline)


Since we used the --pretty switch, the file looks like this:


Processing Windows 10 prefetch files on operating systems less than Windows 8

The Windows API contains support to decompress Windows 10 prefetch files starting with Windows 8. Since I rely on the Windows API to decompress prefetch files created on Windows 10, you must run PECmd.exe on at least Windows 8 in order to process Windows 10 files.

If you attempt to run PECmd.exe on anything less than Windows 8, you will see the the following warning.


This however, should not be a concern as everyone should be running Windows 10 these days! =)

I hope you enjoy the initial release of PECmd! As usual you can find it here or on my Github page for PECmd, which is found here.

Please hit me up with bugs, new feature requests or questions! I would love to hear from you!


PECmd v0.6.0.0 released

$
0
0
Changes in this version include:

  • New: Added --local switch to display dates as local time of machine PECmd is running on vs UTC (which is now the  default in the Prefetch project as well)
  • New: Added --csv switch that accepts a path to a file to save csv (tab separated) output to
  • New: Added source created, modified, and accessed timestamps to output
  • New: Added processing duration to output, both for individual files and the overall process
  • New: Added command line to output
  • New: Added -q for quiet output that suppresses volume, directory, and file output. This speeds up processing when using --json and/or --csv
  • Change: Refactor Prefetch project in reference to getting byte arrays for speed resulting in 10x or so faster processing
  • Change: Some output language tweaks
  • Fix: Fix issue getting 8th run time in Version 26 and version 30 pf files
  • Fix: Fix # of directories when processing XP/2003 pf files as this version doesn't contain a total directory count like other versions

New stuff

Performance tuning

With version 0.5.0.0 out, I wanted to do some performance tuning to see if there were any hot spots in the code that were less than optimal. Several instances of the same type of code were found that caused things to be slower than they needed to be.

Based on the performance testing I was able to change the way I was accessing the byte array containing the different structures and after changing this throughout the code base, files are processed pretty much instantaneously. 

New command line options


There are three new options in this version, q, csv, local.

Local

In this version, all timestamps will be displayed by default in UTC. The local switch will convert the timestamps to the timezone of the computer that is running PECmd. Note however that json output will always be in UTC regardless of the local switch being used.

csv

The csv switch takes a path to file where all prefetch parsing results will be saved to. The separator for fields is a tab character as some of the other fields contain a comma which would screw up parsing.

Here is an example of what the file looks like in a text editor.


To open the file in Excel, open Excel, then use the 'Get data from text' option. Check the 'My data has headers' option in the wizard and click finish.

The csv output has the following columns:

Note: Populated when more than 2 volumes are found in a prefetch file. This is a rare occurrence.
SourceFilename: The full path to the pf file processed
SourceCreated: The created timestamp for the pf file
SourceModified: The modified timestamp for the pf file
SourceAccessed: The last accessed timestamp for the pf file
ExecutableName: The name of the executable tracked by the pf file
Hash: The calculated hash for the pf file. This should match the hash in the source file name.
Size: The size in bytes of the executable
Version: The operating system that generated the prefetch file 
RunCount: How many times the executable was run
LastRun: The last time the executable was run
PreviousRun0-PreviousRun6: For Windows 8 and newer, up to the last 7 times the executable was run is displayed. For version with only a single timestamp, these columns are empty
Volume0Name: The first volume name found
Volume0Serial: Serial # of the first volume
Volume0Created: Volume created timestamp
Volume1Name: If > 1 volume, the second volume
Volume1Serial: If > 1 volume, the second serial #
Volume1Created: If > 1 volume, the second created timestamp
Directories: A comma separated list of all directories accessed by the executable
FilesLoaded: A comma separated list of all files that were loaded by the executable

q

The q switch (for quiet) will significantly reduce the output displayed as processing happens. When processing a lot of prefetch files to json or csv, use this option to get your results as fast as possible.

For example, processing all of the files in the Prefetch test suite without the q option looks like this:

Processed 55 files in 2.2649 seconds

With the q option, it looks like this:

Processed 55 files in 0.3933 seconds

Other stuff

Finally, this version includes a few cosmetic tweaks to the output such as how long it took to parse a file, adding the command line arguments to the output, the total time to process all files (when using -d), and the MAC timestamps of the pf file itself.


That's it for this version. Please let me know what you think!

You can get it here.


bstrings 0.9.9.0 released!

$
0
0
A few days ago on Twitter Jared Greenhill asked if bstrings supported showing the offsets to strings. This is something I have been planning to add support for for a while now and it is now complete!

The following changes have been made in this version:

- Added --off switch to show offsets of string hits. The encoding of hit will be shown in parenthesis after the offset (A=1252, U=Unicode)
- Change from UTF8 to Windows-1252 encoding to find non-Unicode strings


As an example, without the offset switch, searching against a Registry hive results in the following:


The --off switch changes things in that the offset to each hit will be added to the output, along with an indicator of how the string was encoded (A for 1252 and U for Unicode).

With the -off switch present we get a different result:


Notice now we have many more strings. This is because in the previous search, duplicate strings are discarded but when using --off, every instance of every string is reported.

Here is a snippet of search results:


In the results above we can see a string at offset 0x8B526.  After the offset is an indicator of the encoding for the particular hit. An A indicates a match using the Windows-1252 encoding and a U indicates a Unicode (UTF-16) hit.

Jumping to this offset in a hex editor shows the following:


As you can see, the string listed starts at the referenced offset.

If we look at offset 0x75AA2, we can see a Unicode string:


You can sort the results as well using --sl and --sa depending on your needs.

That is it for this release! If there's anything else you want me to add, please let me know!

You can get it here or on Github.


bstrings 1.0 released!

$
0
0
While browsing https://www.reddit.com/r/computerforensics/ today, forensium asked for some changes to bstrings such as:

  • Being able to supply the Code page when searching for non-Unicode (I will refer to this as ASCII) strings
  • Being able to supply the range of characters when searching for Unicode and ASCII
  • Being able to supply a file mask such as *.dll, or *.exe 

After reading his post, I took a look at the code and made implemented his requests by adding several new switches:
  • ar: ASCII character range. This should be specified as a regular expression, such as [\x20-\x7E]
  • ur: Unicode character range. This should be specified as a regular expression, such as [\u0020-\u007E]
  • mask: When used with the -d switch, allows for specifying a wildcard (* and ? are supported), so you can do something like -d C:\windows\system32 --mask "*.dll"
  • cp: The identifier of the codepage to use. 1252 is the default, but if you really wanted to search for IBM EBCDIC Turkish encoded strings, you can do --cp 20905 and go crazy

With that, here is what the new options looks like:


Masks

To demonstrate the --mask switch, lets look for dll's in one of my temp folders:


Here you can see *.dll was expanded to the two dll files in the specified directories.

In addition to the --mask switch, we limit our results to strings over 50 characters to keep things simple. Easy! 

Note: --mask only works when using the -d switch!

Specifying ranges of characters to search for

Next, let's take a look at the --ar and --ur switches (although we will only demonstrate one of them for simplicity).

To demonstrate the effect, let's only look for ASCII hits (so we disable Unicode searching with -u off) that are 35 characters or longer.


As you can see, we found 36 strings using the default range of "[\x20-\x7E]".

Now let's change our range of characters to "[\x20-\x47]" by using the --ar switch:


As you can see here, we have limited the characters we are interested to numbers, some symbols, the space character, etc.

Because of this, we have a lot less hits from the initial search above.

The --ur switch works exactly the same way.

Code pages

Finally, let's get crazy with the --cp switch!

You can get a list of all the valid code page identifiers here.

Using the default code page (1252), we get back 520 strings in 0.059 seconds (full output truncated for brevity):


But if we change the code page, things change:


So now if you are looking for data in any of the supported .net encodings, you can find it!

You can get the latest here and here.


Introducing LECmd!

$
0
0
LECmd, or Lnk Explorer Command line edition, is a tool to decode all available information contained in shortcut files found on Windows operating systems.

For some background on lnk files, start here and to get really in the weeds, check out Microsoft's documentation here as well as Joachim Metz documentation here.

Why create another lnk processing tool?

In short, because existing tools didn't expose all available data structures and/or silently dropped data structures. 

In my opinion, the worst sin a forensics tool vendor can commit is to silently drop data without any warning to an end user. To arbitrarily choose to report or withhold information available from a file format takes the decision away from the end user and can lead to an embarrassing situation for an examiner. If tools reported to end users about the presence of additional data, the end user could then look into what was missing and decide whether or not the data not being shown is forensically relevant to their case.

I also have need for handling lnk files in several of my other programs. Prior to this I was using Shellify, but found it was doing some things I didn't like or it didnt understand certain data structures.

The core functionality in LECmd comes via my Lnk project, which is open source and available here.

LECmd is also open source and can be found here.

LECmd overview

As with most of my tools, running without any arguments will display all available options:


If you are familiar with PECmd, my prefetch tool, the options will look very similar.


Processing a single file

In the next section we will look at the different parts of the output individually in order to keep the images a bit smaller.

To process a single file, use the -f switch, as seen below:


Header and other information

Here we can see things such as the source file, its MAC timestamps, and the lnk file Header information.

The header contains the lnk file's target MAC timestamps, the target's size, flags, etc. Depending on the flags present in the header, additional information is available such as working directory, relative path, etc.

The flags in the header also determine what other structures are available in the lnk file. You will see some of these structures in more detail below.

Link information

The next section, if present (i.e. the HasLinkInfo flag is set), is the Link information.

The Link information section also has flags that determines what structures live within the bytes that make up the Link information.

As you can see below a flag is set that tells us there is a Volume information structure. This structure contains such things as the serial number and type of drive the lnk file's target lives on.


In some cases, the Link information will contain a different flag, CommonNetworkRelativeLinkAndPathSuffix. When this flag is present, we get additional information such as a UNC path to a share, the type of share, and so on.

Target ID information

The next section, again only present if a flag is set, is the Target ID information. It looks like this:


This structure contains shell items that are very similar to what is found in Shellbags including MFT information, timestamps, and so on.

Looking at the top of the image above, we see an Absolute path.

NOTE: Absolute path is NOT stored in the lnk file. This path is calculated by looking at all the shell item structures that are present and building the complete path from them.

The absolute path is nice because it can resolve things for you that you cannot see in the relative path we saw above. If you had an image of the hard drive you could always recreate this but this saves you time.

Each section in the Target ID information section starts with a dash followed by the type of shell item, followed by the value. When more information is present, such as in directory or file shell items, additional information from extension blocks is shown.

As you can see above, our old friend, Beef0004, is alive and well in lnk files just as in shell bags.

Extra blocks information

Finally, we have the the extra blocks information section. This section can contain many different kinds of information ranging from console properties to serialized property store structures. here is an example of a Console data block:


Property store data block

Getting back to our original lnk file we processed, in the image below, we can see several extra blocks including a property store and tracker database block, both of which are discussed below.


The Property store data block contains a list of key/value pairs and an associated GUID. A GUID plus a key relates to a certain type of information that is consistent in property store structures.

In the example above, the GUID/key pair:

46588ae2-4cbc-4338-bbfc-139326986dce\4    

maps to a description of:

SID

and the value of this GUID/key pair is:

S-1-5-21-2092377875-1431633947-1539857752-1075

Here is another example of the various kinds of information contained in the property store data block:


Tracker database block

The Tracker database block contains things such as the NETBIOS name of the computer where the lnk was generated as well as as several GUIDs pertaining to the volume and target file.

The GUIDs used in lnk files are generation one GUIDs and based on this, we can extract the MAC address of the computer and a timestamp from the File Droid GUID.

The File droid GUID in this case is 31a6cdbd-319f-11df-b163-001e4ff01cc7 and if you look at the last part of the GUID, 001e4ff01cc7, you can see this is corresponds to the MAC address.

There is also a formula for extracting the timestamp for the GUID. This timestamp becomes the Creation timestamp in the Tracker database block.

LECmd takes things one step further in that it resolves the vendor who made the network device. In the above image, we see the MAC vendor is Dell. As with the absolute path, the vendor is not stored in the lnk file itself.

Export options

LECmd can export the entire data structure of lnk files to json files and optionally pretty format the information, as seen below:


This lets you ingest lnk data into any other system that understands json data.

When exporting json data, one json file will be created for each lnk file processed.

You can also export to CSV (well, its tab separated, but you get the idea). When exporting to CSV, one CSV file will be created for all lnk files processed.

For example, if we process a directory and export to CSV as seen below:


We get a file that looks like this:


Which can then be imported into Excel and ends up looking like this:


LECmd is also fast! Here we can see we processed 998 out of 999 images in about 20 seconds. Most of that time is due to displaying the data to the screen.


If we redirect the output to a file, things speed up dramatically, like this:


In both examples, notice how any failed files are displayed at the end along with the reason the file could not be parsed.

Suppressing data

Finally, there are two options to suppress displaying of data, --nid and --neb. When these switches are used, either the Target ID information and Extra blocks information will be suppressed. These switches can speed up processing a large volume of lnk files as all of the data in those two sections won't need to be displayed.

That's it!

That sums up everything LECmd can do for you. You can get LECmd here or here.


If there is anything else you want LECmd to do, or you find a lnk file it cannot handle, please reach out to me so I can get the issue resolved or add your feature request for you.


LECmd v0.6.0.0 released!

$
0
0
Changes in this version include:

NEW: Added -q switch for quiet operation. Useful to suppress output to screen when using the various export options
NEW: Added --xml switch for XML output. This expects a directory name
NEW: Added --html switch for Html (well, xhtml + css) output. This expects a directory name

CHANGE: Handle cases where people use strange options for some of the switches

FIX: Corrected flip flopped TargetModified and TargetLastAccessed timestamp in output. The parser is right, but LECmd had the properties reversed.

I did some general refactoring here and there as well.


Let's take a look at some of the changes

When exporting to csv, html, xml, and/or json, the -q switch prevents LECmd from displaying all the details about a lnk file. This greatly speeds up processing.

Without using -q, processing 998 lnk files takes around 20 seconds, but if we use -q, the same processing is far quicker, as can be seen below.


As you can see, we now finish the job in 1.03 seconds!! Not too shabby


LECmd already supported json export, but this release adds XML (which works the same as exporting json) and HTML export options.

XML export is basically the same data available in CSV export, but in XML format, as seen below:


When LECmd exports XML, it is all on a single line. I formatted things in the image above so you can see the kinds of info available in there.

LECMD can also generate a nice HTML report for your lnk files. Using the --html switch results in a new folder being created in the directory passed into the --html switch.

For example, if you exported HTML to c:\Temp, your HTML results would be created in:

c:\temp\20160216205056_LECmd_Output_for_c_Temp_

The new folder starts with a timestamp followed by 'LECmd', followed by the path processed (with colons and slashes converted to underscores).

Inside this folder will be three files:

index.xhtml
normalize.css
style.css

The css files control the look and feel of the report, so if you are into customization you can change these to suit your tastes.

index.xhtml contains all the data and, when combined with the css definitions, ends up looking like this in a browser (I used Chrome, but any should work):


That's it for this release. Get it here or on Github.

P.S. PECmd will also be getting HTML export in its next release


Jump lists in depth: Understand the format to better understand what your tools are (or aren't) doing

$
0
0
A few days ago I was emailed by Harry Parsonage after he tried LECmd (he liked it!). He recommended some changes to the date format used for CSV output which I will be implementing in the next release of LECmd (and PECmd too) that will allow for better sorting and what not.

In closing. Harry requested that I take a look at jump lists next, so I did.

Background and some opening thoughts

Some basic background on jump lists is available here, although as we will see soon, there are some things that have changed (and in doing so have broken jump list tools).

While at the end of the day it is up to each and every examiner to understand the data they are looking at (and hopefully this post and others of mine like it aim to help people understand WHERE things come from vs. just consuming results), there is also some responsibility with tool developers as well.

I know I sound like a broken record about this, but when a failure to parse something correctly happens, it is imperative to warn end users so they can at least have a chance to look into why things failed.

As I mentioned in my SANS talk last year, I am a big believer in the following principles:

  • It is not up to a developer to decide what is relevant to include or exclude. 
  • It is better to spectacularly fail and tell the end user than silently drop data
  • Without access to all the data, how would you know what was missing?

As I also pointed out, it could be argued if you have the file containing the artifact you are interested in, you do have all the info, but this is a heavy lift when it comes to verification in a hex editor.

From a developer's perspective, finding and fixing issues is, in my experience, best handled with unit tests that can find problems for you as long as you keep feeding the test suite new data as new operating systems and/or updates are released. Once you have a decent set of unit tests established that enforce basic rules, these tests will tell you if something has changed.

If you do any kind of development at all, you owe it to yourself and the community of people who use your tools to learn a unit test framework for whatever your particular programming language is. While it is true it is more work to write tests up front for things, it will save you a lot of time down the road and essentially lets you refactor without worrying whether or not your changes have broken something.

This whole unit test thing will come up again below! =)

And now, back to jump lists

If you have ever right clicked on an icon on the Start bar in Windows 7 and newer, you have most likely seen what is commonly referred to as a jump list. They look like this:


But how does Windows know what to open if you click on one of the entries in a jump list? Well, Windows uses the same mechanics to open an item on a jump list as it does when you open a program by double clicking a shortcut on your Desktop.

Simply put, jump lists (at least the two specific kinds we will be discussing) are, at their heart, a collection of lnk files wrapped in a single file. Of course there is bit more to it than that (which we will see below), but because of how prevalent lnk files are when dealing with jump lists, it is a good thing to understand what is available in lnk files. 

As luck would have it, my lnk parser, LECmd, can display the contents of lnk files in all their glory. 


This post will not be getting into the particulars of how jump lists are created or updated, but rather will explore what the data format looks like for two kinds of jump lists: automatic and custom destinations. Let's start with the simpler of the two, custom destinations.

As with many file formats, Joachim Metz has a working specification on the layout of jump lists. If you are into that thing (and who isn't), be sure to check it out.

Custom destinations

One way a custom destination file (*.customDestinations-ms) is created is when a user pins an item in a jump list. Harlan spoke of this way back in 2011.

They can be found in the following directory:

C:\Users\<UserProfile>\AppData\Roaming\Microsoft\Windows\Recent\CustomDestinations

A custom destination jump list file generally looks like this internally:
  • Header
  • Series of lnk files concatenated together
  • (Possibly other data structures in there)
  • Footer (Signature 0xbabffbab)
As an example of one kind of custom destination jump list, here is what one looks like in a hex editor with the relevant parts highlighted.

The purple at the top is the header, next is the first lnk file in pink (or is that salmon?), and finally, the beginning of the next lnk file is in green.


At the very bottom of the file is the footer:


If we carve out the bytes in pink and save them to a file, we can use LECmd to process it, like this:


So now all a parser has to do is understand how to pull out the lnk files from  *.customDestinations-ms files and you can extract all the details contained in said lnk files using the tool of your choice.

Nice, but how can we know where the lnk files start and stop? It would have been nice if each was prefixed with the number of bytes so that we could read that size and then read that number of bytes. Alas, this is just a dream.

The way I process custom destination files is to look for a few unique things about lnk files amongst the sea of bytes:
  • Header length: 0x4C
  • Lnk class Identifier GUID: 00021401-0000-0000-c000-000000000046

One thing you might notice is that the bytes that make up the GUID aren't in the same order in the lnk file itself. Because of this, we have to look for a pattern in the bytes that looks like this:

4C 00 00 00 01 14 02 00 00 00 00 00 C0 00 00 00 00 00 00 46

where the first 4 bytes are the header length and the next 16 make up our GUID. 

If we can find the offset to each of those, we have the offsets where each lnk file starts. Since we know where each starts, we can then start at the first one and use the offset to the second to calculate how many bytes is in the first lnk file. This works fine until we get to the last one. For this one, we need to find the offset to the footer and use this offset along with the starting offset of the last lnk file to find the number of bytes in the last lnk file.

And that is how custom destination jump lists are stored on disk. 

To wrap up, I manually carved each lnk file out of the custom destinations file we have been looking at and processed them with LECmd. In each lnk file is a "Property store data block" that contains a "Title" property. Here are the titles from each lnk file (in order of their appearance in the custom-destinations file):

  1. Start Capture
  2. Toggle Capture Window
  3. Create New Image
  4. Convert Images

Now, let's look at the menu that pops up when I right click on the Snag-It Editor on my task bar. 

As you can see, the entries at the top of the list have been 'Pinned' to the jump list and that is why they are in this particular custom destinations jump list. Cool!

Automatic destinations

With the simpler of the two jump list formats out of the way, now we can move on to automatic destinations, (*.automaticDestinations-ms). These files are found in the following folder:

C:\Users\<UserProfile>\AppData\Roaming\Microsoft\Windows\Recent\AutomaticDestinations

Automatic destinations jump lists are stored in Object Linking and Embedding (OLE) Compound File (CF), or OLE CF, format. In order to have a discussion about automatic destinations jump lists, we will need to have a basic understanding of this file format. All of the nitty gritty is available here, but let's explore the file format a bit, then move on to how this is relevant as it pertains to understanding automatic destinations jump lists.

Keep in mind this is an overview and as such, parts have been simplified a bit.

OLE CF files

Note: I wrote my own OLE CF parser in C# which is available here if you want to see all the details.

Why did I write my own? For the same reasons I wrote my other parsers: To validate working documentation/file specs and implementation details (not to mention I prefer C# as a programming language).

OLE CF files have the following primary structures:
  • Header
  • Sector Allocation tables
  • Directory
The header is 512 bytes long and contains a bunch of critical information needed to parse the rest of the file.

This is what a header might look like:


Some of the more important properties are:
  • Sector size at offset 30
  • Short sector size at offset 32
  • Total Sector Allocation Table (SAT) sectors at offset 44
  • Sector ID of of first sector used by Directory at offset 48
  • Minimum size of a standard stream in bytes at offset 56
  • Sector ID of the first sector used for the Short Sector Allocation Table (SSAT) at offset 60
  • Total sectors used for SSAT at offset 64
  • First part of Master Sector Allocation Table (MSAT) starts at offset 76


To get the actual number of bytes used for a sector and short sector, raise two to the power of each size. For example, if sector size is 9, then the sector size in bytes is 2 to the 9th power, or 512, bytes. If short sector size is 6, then the short sector size in bytes is 64.

Once you know the sector size (ignore the small sectors for now), you can now divide the OLE CF file into chunks that are each the "sector size in bytes" bytes long. Each of these is a sector.

One thing to keep in mind is that sector numbers are relative vs. absolute offsets. To calculate an absolute offset to sector data, we have to take our sector number, multiply it by the sector size, and then add 512 bytes for the header to it. This will come up a lot later.

This concept will work in a somewhat similar way for small sector storage as well, but in the small sector storage case, once we have the bytes that make up the small storage space (more on this later), the small sector number is in fact absolute from the start of the bytes that make up the small storage. We could of course just calculate things in a similar manner as above (header size + absolute offset to small storage + (small sector size * small sector #) but its easier to visualize if you think of small storage as its own little island of data (at least for me it is).

The next thing to understand is the minimum size of a standard stream value. In most cases this value is 4096. This threshold determines whether things stored in the OLE CF file will be kept in primary storage or in small storage. The reason for this is primarily one of storage efficiency. If you are storing a bunch of small things then, it is a waste to store them in increments of 512 bytes when you only need 87 bytes.

SAT AND SSAT

Next, lets talk about the SAT and SSAT. Both work in essentially the same way in that they track which sectors or small sectors are part of a run of data, are free, etc.

Think of both of these structures as an array where each slot contains a number. This number can indicate a few things but typically the number in each slot will indicate the next slot to go to, an end of run indicator (-2), or an indicator that the record is free (-1)

To build the SAT and SSAT, we first have to look at the Master Sector Allocation Table (MSAT). As indicated above, the MSAT (up to the first 109 parts anyways) is stored in the header starting at offset 76. At this offset is a run of 109 32-bit (4 byte) signed integers that point to the sectors that we need to read to build the SAT and SSAT.

As a simple illustration, suppose we had data as seen below starting at offset 76:

00 00 00 00 == 0 decimal
80 00 00 00 == 128 decimal
00 01 00 00 == 256 decimal
80 01 00 00
00 02 00 00
80 02 00 00
00 03 00 00
80 03 00 00
00 04 00 00
80 04 00 00 == 1152 decimal
00 05 00 00 == 1536 decimal
80 05 00 00
00 06 00 00
80 06 00 00
00 07 00 00 == 1792 decimal
FF FF FF FF == -1 decimal

These values correspond to the relative sectors where the data that makes up the SAT can be found. Now all we have to do is go to each position as specified in the MSAT (until we see -1 as that indicates its free), gather the data, and concatenate it together with what came before it. Once we do this we will have our Sector Allocation Table.

An example

Let's look at an example for a few of them to make things more clear.

In order to find the absolute offset, we apply the formula we saw earlier.

The first one is easy.

(0 * 512) + 512 = 512 or 0x200

If we look at offset 0x200 in a hex editor we see the following:


As another example, if we look at the second entry, we can calculate it as follows:

(128 * 512) + 512 = 66048 decimal, or 0x10200

If we look at that offset in a hex editor we see the following


Once we do this for all the sectors we can now find the data that belongs to things that are stored in the SAT (remember, this is anything bigger than 4096 bytes).

If we look at the first chunk of data above for our SAT, we see the following (grouped in 4 byte chunks):

FD FF FF FF == -3 decimal
08 00 00 00 == 8 decimal
15 00 00 00 == 21 decimal
04 00 00 00 == 4 decimal
05 00 00 00 == 5 decimal
06 00 00 00 == 6 decimal
07 00 00 00 == 7 decimal
09 00 00 00 == 9 decimal
12 00 00 00 == 18 decimal
0A 00 00 00 == 10 decimal

and so on.

if we visualize this in a different way, like this:


we can start making sense of things a bit better.

The first entry in each sector that makes up the SAT has a special signature, FD FF FF FF, which is -3 in decimal. If you build out a SAT that came from more than one sector you will see this signature in it. Since each sector is 512 bytes and each sector ID is 32 bits long, that means we get 128 sector IDs out of one sector. Based on this you should see -3 every 128 entries in the SAT. Moreover, since we know this signature will always be the first entry in a SAT sector, we can check for it when we go to an absolute offset. If we see -3, we know we are in the right place. If not, the math is off.

Recall that one of the important header fields is the sector ID of where our Directory starts (we will cover exactly what the Directory is later). In our header above, this is found at offset 0x30, which is 1 in this case. Based on this, we can start building our data run for where sectors that hold our Directory live.

As we did with the SAT, we need to go to each sector in the run, get some data, and concatenate it together. Once that is done, all of the Directory entries can be processed (again, we will get to this later).

So in our SAT above, if we look at slot 1, we see an 8. Next we go to slot 8 and we see an 18, next we would go to slot 18 and see what number is there. We continue to do this until we get to a slot with a -2 in it as -2 indicates the end of the data run.

So, for the bytes that make up the Directory, we repeat our process as we saw above:

Start with sector 1, which is (1 * 512) + 512 = 1024 (0x400) bytes from offset 0. Looking there, we see:


Slot 1 points to slot 8, so we calculate again:

(8 * 512) + 512 = 4608 (0x1200)

Looking there, we see this:


And so on for all the sectors in the run that makes up the directory.

You may already be able to see a pattern in there, but if not, don't worry, we will discuss the Directory soon. The important thing to grasp here is how we find our data run and then go get the bytes that make up whatever it is we are interested in.

Break time

Whew! That was a lot of information! Go get a cup of coffee. Don't worry, I'll wait.

Back to it

Now that we have the SAT out of the way and we understand how we get the bytes for a particular structure, we can now talk about the SSAT. The SSAT works exactly the same way as the SAT did in that it is way for us to look up our data runs for things stored in short storage. Not every OLE CF file has a SSAT, so you have to check if the sector ID for the first SSAT sector is greater than 0. If there isn't a SSAT, the sector ID will be -2.

To get the bytes that make up the SSAT, we follow the data run, just like we did for the directory. Once we do this we will get another list of things like we did for the SAT (think slot 0, slot 1, slot 2, etc).

In our example above, the SSAT first sector is at offset 0x3C. In  the header above, this value is 640 decimal, or 0x280. Again we do the math and we get: (640 * 512) + 512 = 328192 or 0x50200

Looking at this offset we see:


This is now works the same as we saw when building our SAT. The difference between the SAT and SSAT tho is where we go to get the data. Before we talk about that however, we need to talk about the Directory.

Directory

The Directory is made up of directory entries, each 128 bytes long. A directory entry contains such things as a name, a type, a creation and modification time, a sector ID of the first sector that contains the data for the directory entry, and the size of the directory entry in bytes.

The Directory is basically a catalog of all of the objects which are stored in an OLE CF file. Recall earlier that we built out our directory bytes by using the SAT. The first part of the Directory bytes looked like this:


Since each directory entry is 128 bytes long, let's dissect one


So the following is true about this directory entry:

Name:  Root Entry
Name length: 22 (includes terminator)
Type: 05 (5 denotes root storage, but other common ones are 1 for storage, 2 for stream, etc)
Created on: (creation date not stored)
Modified on: 02/22/2016 18:09:43
First sector ID: 3
Size: 611136 bytes

This process is repeated for every 128 bytes that we find in the bytes that make up the Directory object.

Root Entry is special

In the above example, we can see the name is Root Entry and the size is 611,136 bytes. The root entry is a special directory entry in that the bytes in the Root Entry are the bytes used when we have to get data for an object stored via the SSAT. In other words, all objects smaller than 4096 bytes will end up being in the Root Entry object. In jump lists, this means pretty much all lnk files will be found inside the Root Entry bytes.

If you think of the SAT corresponding to the entire jump list file, the SSAT corresponds to just the bytes that correspond to the Root Entry data. In this case, the size of the data for the Root Entry is greater than 4096 bytes, so we need to use the SAT to get the data. Once we have that data, we can cut it up into 64 byte chunks and index each of these chunks starting at 0.

From there we can, as needed, get the bytes for things stored in the SSAT by building data runs from the SSAT and then going to the bytes referenced by the Root Entry (the 611,136 bytes previously discussed). As each 64 byte chunk is found according to the data run, it is concatenated together. When we are done we will have the bytes (and possibly some slack) for a stored object. To determine the bytes that make up the logical "file" we use the size of the Directory entry. Anything beyond that size, up to the end of the bytes that were concatenated together, would be considered slack.


So now that we have seen how the core concepts of the SAT, SSAT, and the Directory work, we now have the means to find blobs of data (and the type, timestamps, etc.) that lives inside an OLE CF file.

Cool!

There is one other special directory entry, the DestList, that we will talk about next.

DestList

If we extract the bytes as indicated by the directory entry named DestList, we get something that looks like this:


The DestList directory entry contains a 32-byte header followed by DestList entries which are of variable size.

The header contains things like:
  • Version number
  • Number of DestList entries
  • Number of pinned DestList entries
  • Last entry number used

and each DestList entry contains things like:
  • Volume Droid ID
  • File Droid ID
  • Birth volume Droid ID
  • Birth file Droid ID
  • Hostname
  • Entry number
  • Last modified timestamp
  • Pin status
  • Path size
  • Path

Jump lists prior to Windows 10 used a version number of 1, but in Windows 10 (which RTM'ed on July 15, 2015), this version number is now 3. This is because the structure of a DestList entry has changed and this in turn broke just about every tool that can parse jump lists. This may range from crashing to displaying only part of what is in a DestList and silently dropping the rest.

I have been running Windows 10 since its release and as such, started using Windows 10 jump lists for my testing. When I got to DestList parsing, my code was failing after implementing the working specifications I linked to earlier (Metz stuff).

I then did some Googling and found one reference to Windows 10 and a change in jump list format:

In this post, ssenyl documented the changes he saw and after coding my parser I can confirm his conclusions based on the data I have available in my unit tests.

The difference between the two formats is not drastic, but it is enough. In version 1, the path is found at offset 114 and in version 3, it is at offset 130.

But where are the lnk files?

Ah, I am glad you asked! Recall the Directory is like a catalog of everything stored in the jump list. Each lnk file that is referenced by a DestList entry is stored as an item in the Directory and has all the same info (Name, start sector, etc) we saw when we initially discussed the Directory. To get the bytes that actually make up a lnk file, we simply check the size of the lnk, then use either the SAT or the SSAT to build our data run and gather the bytes we need.

Putting it all together

Forgoing all the nasty stuff going on under the hood, when processing automatic destinations jump lists, things boil down to the following:

1. Process all Directory entries
2. Find DestList
3. Process DestList entries
4. For each DestList entry, find the corresponding Directory entry where DestListEntry.EntryNumber == DirectoryEntry.Name
5. Once we have the Directory entry for the lnk file, we can go get the bytes that make up the lnk file.
6. Display DestList info and dump information about lnk file

Step 5 is the important one, so let's look at that a bit closer. 

Below we have a DestList entry with entry number 1112, or 0x458.


Next, we need to look for the Directory Entry with a Directory Name of 458. When we find it, we see it looks like this:


Now that we have our Directory entry got the lnk file, we now know how big the Directory entry is (864 bytes) and that we need to use the SSAT to go get the data because the size is less than 4096.

So if we use the SSAT to build our data run, gather our data, and write it out to a file named, for example, 458.lnk, it would look like this:


If we look at the properties for this file, we can see the size, which matches what we expected from the Directory entry:


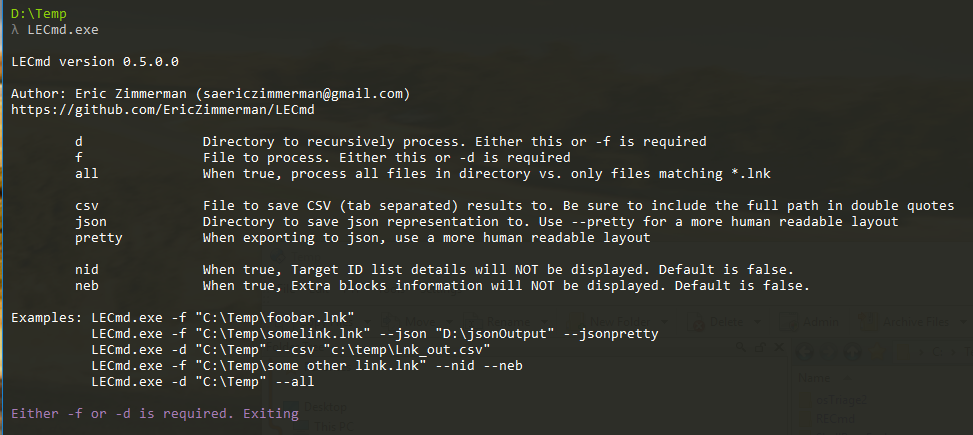
and finally, if we process the file using LECmd, we can see all the details:


Now we just do that hundreds of times in a few seconds and you have the contents of jump lists at your disposal! 

Some tool testing

Note: If anyone has any other tools known to work (or not work) for Windows 10 jump lists, please let me know and I can update the post. I know as of X-Ways Forensics 18.8 preview 3 that Windows 10 auto dest jump lists are parsed properly. Here is the partial output of the jump list we have been discussing in X-Ways:


The Total property above is the value of the Last entry number from the DestList header.


Here is an example of the amount of data that is available in the auto dest jump list we have been discussing.

The following objects are what my OLE CF project builds when parsing an automatic destination jump list.

Notice the number of DestList entries in X-Ways matches what I have calculated (673) and this matches what is in the DestList header


You can see DestList has 673 entries and DirectoryItems has 675. In this example, there is one Directory entry for each DestList. The two extra Directory entries are Root Entry and DestList.

The above screen shot is from Visual Studio debugging my OLE CF parser. If we expand the DestList entries collection, we see this:


Here I have two of the 673 DestList entries expanded, but you can see the detail in there.

Notice the first entry (0) references a path that contains "DarkCometInformation.txt", the second (1) references "Internet.pdf", and that both of these are referenced in the partial X-Ways output as well.


For the rest of the discussion, keep in mind there are 673 DestList entries in this particular auto dest file.

Here is what one very popular tool (according to the Twitterverse) outputs when parsing this same jump list:


Only the first DestList item is displayed.

Here's the output from another popular tool:


With this example you can clearly tell something is wrong.

Here is another tool that tells us there is a problem:


And another:


And another that indicates an issue:


And another:


Who cares?

Well, Windows 10 has been out for a long time now and with Microsoft's push to get to a billion installations continually ramping up, examiners will start seeing more and more Windows 10 boxes.


This is where things like unit testing come into play (we have come full circle now!). If a Windows 10 auto dest jump list was added to a suite of unit tests soon after Windows 10 was available, the issue would have manifested itself immediately and could have been corrected much sooner.

In my testing I do things like this:


That last line says if the number of DestList entries does not equal the number of entries as reported in the header, the test should fail. You can see by the green dot it does not fail and I have test cases with over 700 DestList entries in them from Windows 10.


Wrapping up

You still here? Wow! I am impressed! I barely made it myself. I hope this post has made it a bit more clear how jump lists work and the importance of automated testing via unit tests.


The next tool I will be releasing is my jump list (custom and automatic) parsing tool, JLECmd, which will handle Windows 7 thru Windows 10 jump lists. It will be open source and available on GitHub after the initial release.

Output will be similar to the detail you get in LECmd in regard to the embedded lnk files with the additional DestList entry details added on.

Here is a preview:


It will (eventually) allow you to export all free space found in the SAT and SSAT, dump all lnk files out to a directory (this is what I posted about on Twitter, here), and more.

I will have some other surprises too at some point that will make new research into jump lists a lot easier which I hope the community uses to its benefit.

Bye for now!

Introducing JLECmd!

$
0
0
JLECmd, or Jump List Explorer Command line edition, is a tool to decode information contained in custom and automatic destinations jump list files found on Windows operating systems, starting with Windows 7 and continuing through Windows 10.

If you are unfamiliar with jump list files, a previous post, found here, provides background on jump lists including how they are structured and what information they contain.

Why create another jump list processing tool?

Mostly for the same reasons I wrote my other tools: existing ones either didn't work (i.e. no support for Windows 10) or didn't work well enough (IMO).


The core functionality in JLECmd comes via my Jump List project which in turn uses my Lnk project, both of which are open source.

JLECmd is also open source and can be found here.

JLECmd overview

As with most of my tools, running without any arguments will display all available options:


Most of these options will be very familiar if you have used any of my other tools.

To process a single file, use -f and the path to the jump list you want to process.


At the top we see information about the AppID and its description. JLECmd has many built in AppID descriptions and when a match is found, the program the jump list relates to is shown. In this case, we are looking at Windows Explorer.

Since this is an automatic destination jump list, information about the DestList is displayed which includes how many expected entries there should be as well as the actual number of entries that were found. This lets you see any discrepancies between the two.

Below that, each DestList entry is displayed including the entry number, the path, the created and modified dates, host name and MAC address. Below that is the target created, modified, and last access time stamps along with the absolute path the related lnk file points to.

The information about lnk files is kept at a minimum, but to get a bit more detail, use the --ld switch for more lnk detail. Here is an example of this:


The additional information in this case is highlighted in the red box. If you need to see ALL lnk detail, the best option is to export all embedded lnk files and then use LECmd to analyze them. We will discuss extracting lnk files below.


Custom destinations jump lists work more or less the same way, but custom jump lists do not have DestList information.

We will have the AppID but after that, it is only embedded lnk files. Here is an example of what we can see from a custom destinations jump list.


Here is the same file using the --ld switch with the additional information highlighted:


I recently added high precision time stamp support to LECmd and this functionality is also included in JLECmd via the --mp switch. Here you can see the additional time stamp resolution when using this switch.


You can also specify your own time stamp format using the --dt switch and any of the standard .net DateTime format strings. Here we are using a format string of "ddd MMM dd yyyy HH:mm:ss.fff K" which results in the output seen below:


These options are also honored when exporting data to CSV and HTML as well.

Exporting lnk files

As we have already discussed, jump lists are full of embedded lnk files. JLECmd has an option, --dumpTo, that allows for exporting all of these lnk files to a directory. Once exported, any other tool can be used to further analyze the lnk files.

Here we are using the -d switch to recursively process a directory for all automatic and custom destinations jump lists. We are dumping lnk files to c:\temp and are also using the -q switch to minimize output so things process faster.


When processing is complete, any failed files are listed at the bottom of the output along with the reason the file couldn't be processed. In the example below, the custom destinations jump lists were empty and contained no lnk files.


After the export is finished, the Temp folder will contain several new folders based on the name of the processed jump list. These directories will contain the embedded lnk files.

Here is a partial listing of the lnk files that were exported above.


Windows Explorer shows us that c:\temp contains 4,938 lnk files.


Now we can point any other tool at these lnk files. The image below shows LECmd processing all of these lnk files and as you can see, LECmd processed all 4,938 files without issue.


Generating reports

JLECmd supports exporting to CSV, json, and HTML. We have seen examples of json output before, so we will not cover that again.

When generating reports, all of my tools expect a directory path vs. a file. The current versions of LECmd and PECmd expect a file, but this will be changed in the next release of both tools so all of the tools are consistent.

Here we are processing the same directory we saw earlier, but are exporting to CSV and HTML:


Export results will be created separately for automatic and custom destinations jump lists depending on what types of jump lists were found.


Looking in our target directory, we can see several new files and folders.


In both examples below, notice how our more precise time stamps are reflected in the data.


The TSV files can then be imported into Excel, like this:


The HTML output option exports to an XML file and uses CSS to display things in a user friendly manner.

Index.xhtml looks like this:


and when opened in a browser, is transformed into this:


Jump lists have some strangeness to them when it comes to the embedded lnk files. If you run into any jump lists that fail to process, please contact me and I will get things resolved ASAP.

Feedback and feature requests are of course always welcome!

You can get JLECmd at the usual place.


PECmd, LECmd, and JLECmd updated!

$
0
0

Nothing too crazy for this release, but before I get into the details...

I have been nominated for a Forensic 4cast award for Digital Investigator of the year. In 2014, I won a 4cast award for the Forensic book of the year category for my X-Ways Forensics book.

Please take a moment and vote at the URL below:

https://forensic4cast.com/forensic-4cast-awards/

And now, on to our regularly scheduled change logs...


NOTE: All switches for exporting now expect a DIRECTORY and not a file name. This makes things consistent and easier to use

JLECmd v0.7.0.0

- CSS tweaks and HTML format changes
- updated dependencies and nuget packages

The previous version duplicated a lot of things in the HTML output. This version cleans up the redundancy.

Here is an example of automaticDestinations output. In this example we see the end of one jump list and the start of the next. The large number on the left is the entry number. This helps break up the output a bit so its easier to see where things begin and end.


Here is example of a customDestinations jump list. Since there is nothing similar to an entry number in custom jump lists, a counter is displayed that shows the order in which the lnk was found in the jump list. Again, the large number helps break up the flow and allows for a point of reference for reporting, etc.


PECmd v0.7.0.0

- add timeline output when using csv
- CSS tweaks and HTML format changes
- updated nuget packages

The HTML output was tweaked to include an icon for directories and files.


Rob Lee (yea, that one) asked for the capability to generate a timeline when processing prefetch files. This feature was added to the csv export functionality.

Here we are processing a directory for prefetch files and generating csv (well, tsv, but you get the idea):


The implementation is very simple. For every run time stamp in the prefetch file, add an entry in the  time line with said run time and the full path to the executable. This can then be copy/pasted right into a super time line.

Opening the time line output in Excel gets us this:


LECmd v0.7.0.0

- update dependencies and nuget packages
- allow for full precision timestamps via mp
- allow for custom date time format via dt

Since I have added high precision time stamp output and custom date time formatting to my other tools, LECmd how has the same capabilities as seen below:


All of these are available at GitHub under each program's Releases section or as a direct link on the Software page.


Viewing all 76 articles
Browse latest View live