Quantcast
Channel: binary foray
Viewing all 76 articles
Browse latest View live

LECmd and JLECmd updated

$
0
0
Tom Yarrish (via Harrison Mbugi) was doing some testing with LECmd and noticed the target modified and target accessed times were transposed. This issue was tracked down and fixed in my lnk project.

This is what version 0.7.0 was showing:


This is what X-Ways shows for the same lnk file:


And the same file in LECmd 0.7.1.0:


Since LECmd and JLECmd both use this library, both were updated (along with several nuget packages).

Thanks Tom!


bstrings v1.1 released!

$
0
0

I have been nominated for a Forensic 4cast award for Digital Investigator of the year. In 2014, I won a 4cast award for the Forensic book of the year category for my X-Ways Forensics book.

Please take a moment and vote at the URL below:

https://forensic4cast.com/forensic-4cast-awards/

And now, on to our regularly scheduled change logs...


Several weeks ago, Mark Woan emailed me and asked if I could add the ability to supply a file containing strings to search for (and by extension, regex patterns). He also wanted the ability to suppress output to the screen of strings that were found.

To accommodate Mark's requests, the following things were added to bstrings for this release:

  • Add -s switch to suppress output to console. Useful when used with -o
  • Add --ro switch to show only the string that matches a regex vs. the entire string where the regex was found
  • Add --fs and --fr switches which allow for supplying a file containing search terms to look for (--fs) or a file containing regex patterns (--fr). Both files expect one search term/regex per line
This version also saw a change to the regex pattern used for email and a nuget package update.

Once I added the --fs and --fr switches and got things working, I started refactoring code and in doing so made an additional improvement in that you can now use any combination of switches to supply search terms and/or regex patterns. I also threw some performance tuning into this release.

Some examples

In the example below, notice how I provided both a regex pattern and a string to search for:

Of course I could have used either, or both, of the --fs and --fr switches to further extend my searches.

This now allows you to do one search using as many different search terms/regexes as necessary and bstrings will do the work in one pass vs. having to do a bunch of different searches with bstrings to get the same results.

--ro

If we do the same search as above but add the --ro switch, this is what we get:


In the first search, we can see a '&' before the second gmail hit and a phone number after each hit. In the search above, the extra data has been removed and only the string matching the regex pattern is shown. This gives you more flexibility in pulling out only the strings you are interested in finding vs seeing the regex in context with the rest of the string around it.

--fr and --fs

When using the --fr and --fs switches, create a text file and then add one string or regex pattern per line, save the file, and supply the full path to the --fr or --fs switch. bstrings will then read the file and add each entry to the list of items to search for

-s

Finally, the -s switch will suppress showing any hits to the console. This is primarily useful when using the -o switch to save results to a file. but it can also be used if you just want to see how many hits were found in a file vs having to wait for them all to be listed.

Enjoy!

AppCompatCacheParser v0.9.0.0 released and some AppCompatCache/shimcache parser testing

$
0
0
Last week a user emailed me and asked if I would include a column showing whether or not an executable found in appcompatcache was executed.

Once this was done I sent a test version for verification back to the user. They reported AppCompatCacheParser (ACCP) was not displaying all of the entries that other tools were displaying for a few test hives.

After digging into the issue, it turns out the test hive being used contained two ControlSet keys and ACCP was looking at the Select\Current key to determine which ControlSet was active. The active ControlSet was then used to dump shimcache entries.

Since this could lead to data being missed, I refactored things so that ACCP looks for all available ControlSet keys and, by default, processes them all for AppCompatCache values found in a hive.

Whats new in AppCompatCacheParser?

Prior versions of ACCP extracted entries from the active ControlSet. The new version now extracts entries from all available ControlSet keys

Here is an example where a hive has two ControlSet keys:


As you can see, two ControlSet keys were found and will be processed.

The export file format has been changed as well to reflect which ControlSet the entry came from. At the far end is another new column, Executed, that, when available (depending on which operating system the hive came from), will reflect whether or not an executable was run.


The above example shows the transition between things that came from ControlSet01 and ControlSet02.


I also added a -c option which allows for only exporting a certain ControlSet


When exporting a specific ControlSet from a hive, the name of the file will reflect the ControlSet.

Why does it matter?

In my testing, entries were found in one ControlSet that were not present in the other ControlSet. At the end of this post is a spreadsheet with the results of my testing. If you want to see examples of this, open the spreadsheet, go to the appcompatcacheparser tab, then sort by Path. There are several examples where you can see executables from ControlSet02 that do not appear in ControlSet01.

Some tool testing

When the initial issue was reported to me, the results of other appcompat/shimcache parsing tools were provided for a particular hive. Because the hive used to generate these reports could not be shared, I decided to do some testing against a hive I had locally.

After I finished working on AppCompatCacheParser I sent it to the person who requested the new feature to test it against his data. His results were similar to mine for the parsers he tested against.

The data set

The SYSTEM hive used for testing came from a Windows 7 x64 box and has two ControlSet keys as seen below.


Note the last write times are different for each of these keys as well and that the AppCompatCache key in ControlSet01 was written 14 days after the AppCompatCache  key in ControlSet02.

To see which one is current, we look at the Select key and the Current value. Here we see a value of 1, so ControlSet001 would be used for CurrentControlSet in the live Registry


On Windows 7 systems, AppCompatCache maintains a counter for the number of shimcache entries being tracked. This counter is found at offset 0x4.

For ControlSet001, the beginning of AppCompatCache looks like this:


and for ControlSet002, the beginning of AppCompatCache looks like this:


and from this we know to expect 82 entries for ControlSet001 and 12 entries for ControlSet002, for a total of 94 entries.

Here is another visualization of the data from the test hive. Here we can see the ControlSet number, the EntryCount from offset 0x04, and how many cache entries were extracted.


Mandiant ShimCacheParser.py (latest from Github as of 05/17/2016)

(NOTE: Within an hour or so of this post the script was updated to correct this issue)

By default, Mandiant's tool chooses to deduplicate executable names as it extracts entries from each ControlSet it finds. There is however, a verbose option to include everything.

Below we see the bottom of the default output for this tool:


Accounting for the header row, we see there are 85 rows of data in the output.

There is a bug with this tool in that it is dropping the last two entries in the AppCompatCache value (exact details will be shown below).

This issue was reported on the GitHub page pointing to this post on the day this post was published.

While we haven't looked at AppCompatCacheParser yet, here is a comparison between the output of the two tools:

ShimCacheParser.py's two missing rows from ControlSet02 are highlighted in red. There would be two additional missing entries from ControlSet01 as well.


To further verify this, a list of every executable from AppCompatCacheParser's output was saved to a text file. The same was done for every executable from ShimCacheParser.py's output. Both files were sorted alphabetically and BeyondCompare was used to diff the file.


Here we can see the four entries (two from each ControlSet) that do not exist at all in ShimCacheParser.py's output.

The other entries shown above are deduplicated entries.

Finally, the verbose option was used which resulted in the following (the red box denotes the switch from ControlSet01 to ControlSet02):


Accounting for the header row, we see there are 90 rows of data in the output which is four short of what we expect (two from each ControlSet).

In stepping through the binary data from ControlSet02, these are the two missed entries:


These two records correspond to the last two entries in the list (Entry number 10 starts at offset 608 and each entry is 48 bytes, so 2 x 48 = 96 which is how many bytes are selected above).

Entry number 10 breaks down as follows:

Path offset: 1236
Path size: 70
Last modified: 2009-07-14 01:39:07 +00:00

Jumping to offset 1236 shows us this data:


which is the first of our two missing entries from ControlSet02, DrvInst.exe.

Entry number 11 breaks down as follows:

Path offset: 1166
Path size: 68
Last modified: 2010-11-21 03:23:56 +00:00

Jumping to offset 1166 shows us this data:


which is the second of our two missing entries from ControlSet02, sppsvc.exe.

This exercise can be repeated in a similar manner for the missing data from ControlSet01

So in summary, the following entries are missing:

rebuildSearchIndex.exe
RegisterIEPKEYs.exe
DrvInst.exe
sppsvc.exe

Woanware shimcacheparser 1.0.2

shimcacheparser is a port of Mandiant's python version and as we will see, suffers from one of the same issues the Mandiant tool does.

When shimcacheparser is run against our test hive, the following data is exported:


Accounting for the header row, we see there are 10 rows of data in the output which is two entries short of what should be there.

A cursory look at the code shows that while it is looking at every ControlSet key, the results from earlier caches are not saved to an existing list, but rather the existing list is overwritten with cache results. Because of this, only the last ControlSet processed will be reflected in the output.

tzworks wacu 0.2

By default, wacu will only extract the entries from the active ControlSet. wacu does include a switch, -all_controlsets, that will process all available ControlSet keys.

Below we see the bottom of the output for this tool when using the -all_controlsets switch:


Accounting for headers and other preamble information, there are 82 rows of data for the first ControlSet and 12 rows of data for the second ControlSet for a total of 94 rows.

RegRipper shimcache.pl 20160502 and appcompatcache.pl 20150611

appcompatcache.pl extracted 79 rows of data and in reviewing the data it looks like it picked up the entries missed by the Mandiant script from ControlSet01 but did not include any entries from ControlSet02:


I did not look at the code to see if any deduplication is happening because perl. =)

Harlan initially blogged about shimcache.pl here. He describes the script as one that "accesses all available ControlSets within the System hive, and displays the entries listed"

shimcache.pl extracted 86 rows of data but both sets of data were identical to each other even though the output references ControlSet01 and ControlSet02 and they each have different last write times for the keys. It appears as if the same cache value is being processed (ControlSet01 since ControlSet02 in our test case only had 12 entries in it) for every ControlSet key that is found.

Below is the partial listing of shimcache.pl output:


The script is referencing and including the last write timestamp from the Session Manager key as opposed to the Session Manager\AppCompatCache key. Recall from earlier in our test case the AppCompatCache keys from ControlSet01 and ControlSet02 were last written to approximately 14 days apart (10/10/2013 vs. 10/24/2013).

AppCompatCacheParser 0.9.0.0

AppCompatCache extracted a total of 94 entries, 82 from ControlSet01 and 12 from ControlSet02.

Below we see the bottom of the output for this tool:


All 94 entries are accounted for. Additionally, the ControlSet is indicated and each entry's position in the cache is noted.

Summary


How about Windows 10?

All tools, with the exception of Woanware's shimcacheparser (which has not been updated since Windows 10 was released), support extracting entries from Windows 10 hives.

If anyone is interested in an Excel spreadsheet with all the output from each parser in it, you can view it here.


If any tool authors want the hive used for testing in this post, hit me up in the usual places.


I will be speaking about Registry internals at the SANS DFIR Summit in June. Click here for more info!

Thanks for reading and please vote for me for the Digital Forensic Investigator of the Year!


Registry Explorer 0.8.1.0 released!

$
0
0
The primary focus of this release is the addition of plugins. A plugin allows for processing a key and/or value in order to further process the data available within. For example, UserAssist is Rot13 encoded, so the plugin for UserAssist would un-Rot13 the value names and extract other meaningful things from values. All of this information is then returned from the plugin and displayed to the user. The data returned from a plugin can then be sorted, filtered, exported, and so on.

We will cover all of the available plugins that are shipping with this release below.

Before getting into plugin details and some of the other more interesting changes, let's take a look at the changelog.

The changes in this version include:

NOTE: The manual has been updated to reflect everything available in this version. For more details on any of these features, Read The Friendly Manual.

NEW: Change to .net 4.6
NEW: Added exporting of values to Excel, TSV, PDF, and HTML via key context menu (under Export | Values). Data is exported exactly as shown in Values grid (this lets you hide columns, reorder, sort, etc. before export)
NEW: Plugin support added.
NEW: Added View | Plugins to explore available plugins
NEW: Added Base64 to Data interpreter under Strings section
NEW: Added Tools | Preferences
NEW: Option to show (and therefore export) RegBinary values as Base64 strings (enabled in Tools | Preferences)
NEW: Option to show (and therefore export) value slack as Base64 strings (enabled in Tools | Preferences)
NEW: Option to set custom date/time format for timestamps in Tools | Preferences
NEW: For RegUnknown value type, show the actual value of the Registry Type in hex and decimal.
NEW: Ability to double click offset in hex viewers to jump to the offset in either decimal or hex
NEW: When a plugin is added for a key or value, make it the active tab
NEW: Hex viewer allows for selecting bytes and copying as hex, ANSI string (Windows 1252 code page), or Unicode string
NEW: When exporting value data, offer exporting in binary or string format
NEW: Allow for searching for many terms at once vs one at a time in Find dialog
NEW: Change messages count background color to yellowwhen there are warning messages and red when there are error messages. This color will be cleared when the Messages window is viewed.

CHANGE: Disable Bookmarks menu when on Available bookmarks tab
CHANGE: Clear any active filters before selecting bookmarked key
CHANGE: Set focus to last used search type on Find form
CHANGE: Sort bookmarks by name
CHANGE: Load hives when they do not have an nk record with a HiveRootEntry flag set. When this happens, an alternate method is used to find the root key
CHANGE: Put the newest search history items at the top of the list
CHANGE: Don't trust Header length when looking for hbins as sometimes Header length is wrong
CHANGE: Values grid filters use ‘contains’ vs ‘starts with’ as default

FIX: Add missing tooltip to Literal checkbox on Find form
FIX: Update hex position in hex type viewer when moving up and down rows vs only left and right
FIX: Correct issue when selecting hits in Find panel if the Registry keys tree was sorted when a virtual key existed (Associated Registry keys for example)
FIX: Handle rare issue when building virtual keys for 'Associated deleted records' where there is an active key and a recovered deleted key with the same name
FIX: Lots of tweaks and miscellaneous fixes


Thanks to all the beta testers and especially David Cowen and Jerod Alexander for their suggestions and feedback.

General changes

The following sections will cover the more important changes in this version of Registry Explorer. In addition to these high level changes, a lot of polish went into many different areas. 

For example, bookmarks are now sorted by name which makes bookmarks easier to find in the list. In previous versions the bookmarks were listed in the order the bookmarks were read when Registry Explorer started up.

Search improvements

New in this version is the ability to enter more than one search term to look for. In previous versions, only one search term was allowed which meant if you had 10 things to search for you had to search 10 times. 

Because of this new feature, the Find window was slightly redesigned. In the example below, we are searching for nine terms at the same time.


Protip: To initiate a search without having to click the 'Search' button, press enter twice after entering the last keyword.

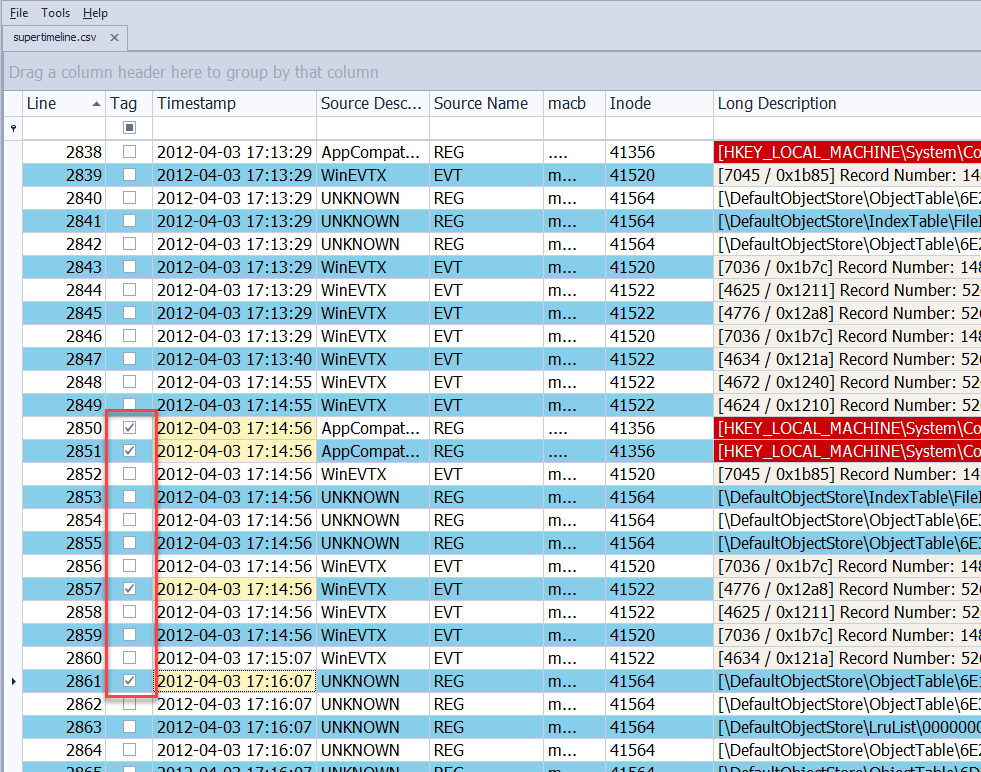
After a search is conducted, the results are displayed as they were in the previous version. In this version, a new column was added, Hit Text, that shows which search term was found for a given key/value. 


This allows you to group by each of the search terms by dragging the 'Hit Text' column to the appropriate spot, filter, sort, etc. When combined with other columns, like the 'Hit Location' column, you can quickly drill down into your results on a more granular basis.

Finally, the history has been updated to include multi-term searches.


Selecting an entry from history will populate the search terms in the 'Search for' box. Use Options | Clear recent searches to purge the history.
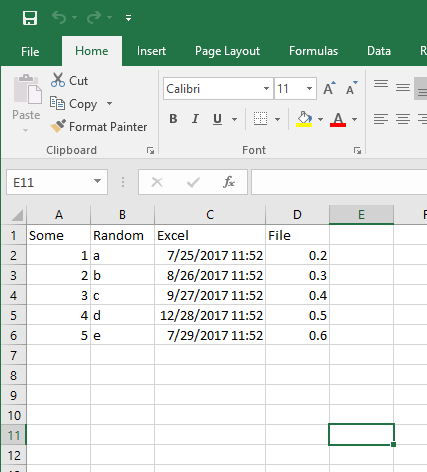
Exporting of values

The context menu for keys now allows for exporting of all values found under a given key to a multitude of formats.


The important thing to remember when exporting values is that the data is exported exactly as shown in the Values grid. This lets you change sorting, hide columns, reorder columns, etc. and have this reflected in the resulting file.

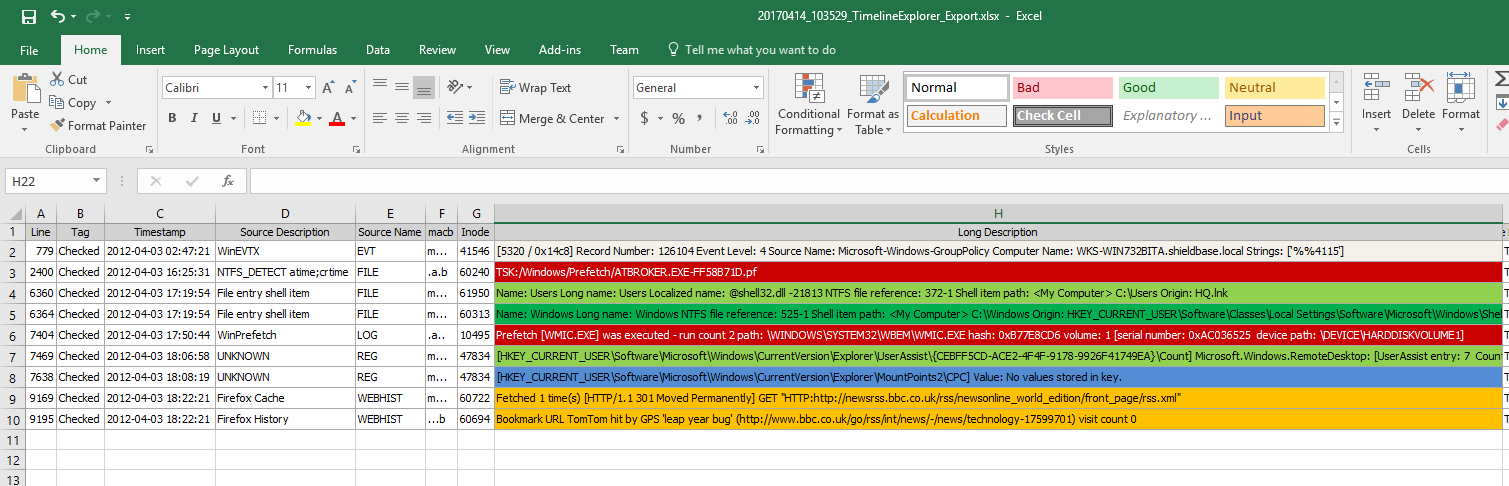
Here is an example of exporting the above key to Excel looks like when the Values grid looks as it does in the above screen shot:


If I were to drag the Value Slack column to the left of Value Name and sort on Value Name, the exported results would look like this (arrow and rectangle added for emphasis of course):


Here we can see the Value Slack is the first column and the data is sorted differently.

The same values exported to HTML would look like this:


New menu options

Options | Preferences

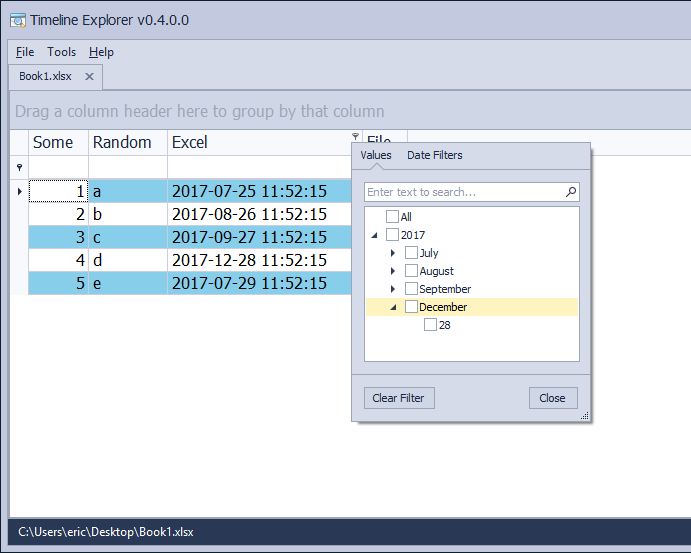
Several new options have been added and are available via Options | Preferences.

The top two options are self explanatory. The bottom option, Date/Time format, controls how timestamps are displayed throughout the program. As the format is changed, the example date/time below the box is updated in real time to show you what the new format would look like.


Changes to the Date/Time format will be reflected immediately in most places as new timestamps are displayed. To completely change over to a new timestamp format, restart Registry Explorer.

View | Plugins

To view all available plugins, use the View | Plugins menu option. 

In the example below we can see that a total of 15 plugins were loaded and the AppCompatCache plugin is selected in the list.


Most of the plugin properties are self explanatory. 

The 'Key paths' property determines what key paths this plugin will handle. In other words, if any of the keys listed are selected, the plugin will be activated. In this particular case, 'Value name' is also populated. This means that not only do one of the key paths have to be selected, but the AppCompatCache value must also be selected before the plugin will be executed. 

Plugins must have at least one entry in 'Key paths' but 'Value name' is not required. When 'Value name' is empty, the plugin will be activated when one of the keys listed is selected.

User interface tweaks

In the lower right corner is a counter that indicates how many messages exist in the Messages window. This window can be seen by either clicking View | Messages or double clicking on the counter.

New in this version is color coding of the counter. Yellow indicates one or more warnings are present in the Messages window. Red indicates one or more errors are in the the Messages window.


After viewing the Messages tab, the background color will change to normal until the next warning or error is observed.

Other tweaks to the user interface include not forcing the slack viewer to be the active tab (i.e. keep the type viewer the selected tab as it will be used more often), disabling bookmarks menu when on the Available bookmarks tab, clearing filters prior to selecting a bookmark, and so on.

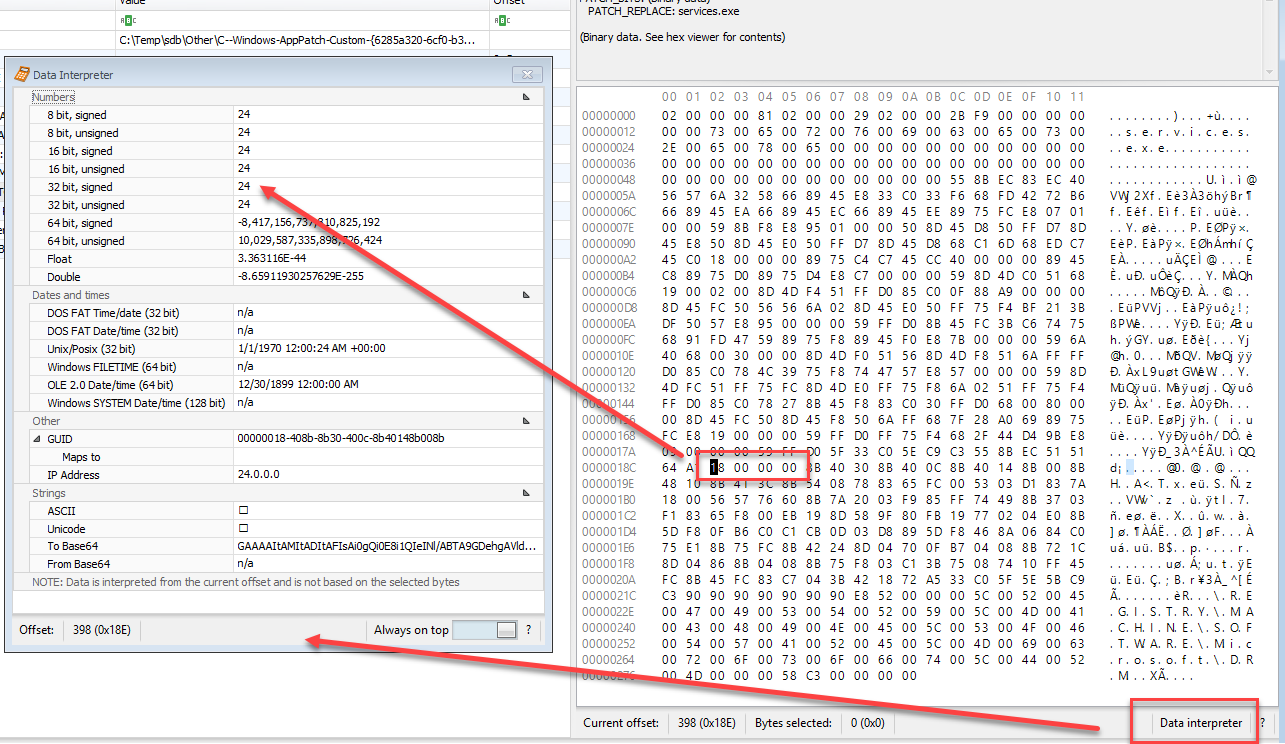
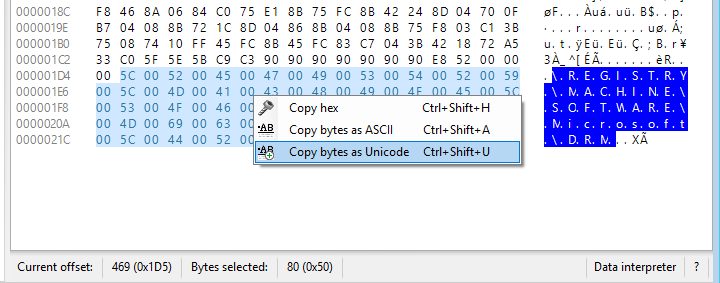
Copying of binary data to different formats

When looking at RegBinary values or value slack, the data is displayed in a hex editor as shown below.


In this release you can copy the selected bytes in one of three ways as shown in the context menu above.

This option augments the ability of the Data interpreter in that it allows you to copy any range of bytes in whatever format you choose.

Plugins

The biggest feature in this release is of course plugins! Plugins are basically a way to decode obfuscated data, correlate several different keys together, and so on.

All plugins also allow for exporting to Excel, reporting of any errors, etc. This will be demonstrated in the 7-Zip plugin section below.


There are two general flavors of plugins, those that handle a key and those that handle a key and value.

Key based plugins

When a key based plugin is activated, a new tab will be created next to the Values tab on the right side. This new tab will contain the processed values or other data based on what the plugin does. The ComDlg32 CIDSizeMRU plugin is an example of a key based plugin.

Key/value based plugins

When a key/value based plugin is activated, a new tab will be created next to the Type viewer tab below the Values tab. The AppCompatCache plugin is an example of a key/value based plugin.


Creating new plugins

All plugins are open source and are available here. The manual for this release also contains a section on how to create plugins as well, so if that is something you are interested in (and I hope you are!), please check it out and hit me up with any questions.

Plugin walkthrough

Let's explore the plugins available in this release one by one.

Protip: Use the Available plugins tab to quickly click on bookmarks for keys that have plugins.


7-Zip history

This plugin is a key/value based plugin. The key is Software\7-Zip\Compression and the Value is ArcHistory. This value looks like this in its native format:


Looking at the binary data, we can see Unicode strings pointing to files 7-Zip has touched. When we click on the ArcHistory value, a new tab shows up next to Type Viewer, like this:


Once the plugin is finished processing the value we get back a listing of the data contained in a much more usable format.

If we look at the plugin results in a resized window we can see some of the other options available for each plugin:


Here we see a counter for the total number of rows, an Export (to Excel) button, and a ? which displays a tooltip showing details about the plugin.

If we export to Excel, we end up with something like this:


Should any errors be detected, this will be shown both with a status message to the right of the 'Total rows' area and via a drop down to the right of the question mark. Clicking on the Errors dropdown will show a list of all errors and the reason for them.

Ares P2P information

The Ares plugin works a bit differently in that it looks at several subkeys and values under the Software\Ares key.

For example, Ares search history looks like this:


but after the plugin processes the key, we get something like this:


Here we can see the search terms have been deobfuscated and are much more useful. We can additionally see other interesting bits of information such as the network ID, last connection time (converted from Unix epoch), port number, etc.

ComDlg32 CIDSizeMRU

This key can be used to glean information about program executions. Beyond the name of the executable as a Unicode string, there is not much more detail available.

This is what the values look like in their native state:


Like most keys of this sort, there is an MRU list. It looks like this:


In the above example, value 6 was last opened. Prior to that, values 4, 0x19, 1 and so on were opened. 

If we look at value 6, we can see a Unicode string in the binary data, devenv.exe.


Since the MRUListEx value would be updated after a new value is added/changed, the key's last write timestamp would be updated to reflect this. Because of this, we can determine when the program in MRU 0 was executed/opened/etc.

Taking all of this information into account, this plugin generates the following results:


There are a few things to notice here. First, the output is, by default, in MRU order. Second, the executable in MRU 0 has an 'Opened on' value that is equal to the key's last write time.

This key has a few unknowns to it, primarily the GUIDs you can see above. To date, no one has been able to figure out where those GUIDs come from or resolve them to a more useful name.

File Extensions

This plugin processes all subkeys found under Software\Microsoft\Windows\CurrentVersion\Explorer\FileExts and extracts a list of programs that have been used to open a file extension. It also, when available, contains reference to the program a user prefers to open an extension with.

This is what the data would look like a given key. First, we have the OpenWithList key's values. Here you can see a list of values and an MRU.


Some extensions have another subkey, OpenWithProgids, that contains pointers to programs vs executable paths.


Finally, some extensions contain a UserChoice subkey that looks like this:


With all of this information in hand, the plugin then generates a list of every extension and program used to open said extensions when the FileExts key is selected. The resulting data looks like this:


Finally, here are a few examples where the 'User Choice' column is populated.


As with all plugins, the results can be exported to Excel and used for futher analysis.

First folder

This plugin displays program executables and optionally, the first folder to select for said program.

It looks like this normally:


We can see each value is RegBinary and in looking at the hex viewer at the bottom, Unicode strings are present. We also have an MRU list.

The plugin processes all of the values and we end up with this:


Like other plugins we have already seen, the list is sorted by MRU order and MRU 0 has its Opened On column populated.

ComDlg32 LastVisitedMRU

This plugin extracts executables along with a corresponding directory path used by the executable. It works similar to other ComDlg32 keys. Plugin output looks like this:

ComDlg32 LastVisitedPidlMRU/LastVisitedPidlMRULegacy

This key is similar to the previous plugin in that it stores executables and a path associated with a given executable. The difference with this plugin is the amount of detail that is stored about the path.

Here is what the data looks like normally:


In the example above, the data for value 2 is displayed in the Type viewer. In the hex display, several interesting bits of information are highlighted. The first, 14 00 1F, is the size and signature for a shell item GUID. The second, 04 00 EF BE, is the signature for a BEEF0004 extension block. This extension block contains timestamps, MFT entry and sequence numbers, and path information. 

If you have looked at ShellBags Explorer you will have seen some of these same signatures. Likewise, if you have used ShellBags Explorer, you know how much rich detail is present in shell items.

When this plugin runs, its output looks like this:


Here we can see the MRU position, executable name, and absolute path that was accessed. When an invididual value is selected in the plugin output, a new tab is displayed below the plugin output, next to the Type viewer, that looks like this:


Notice the Absolute Path column is made up from the diffferent parts of the details presented.

This data is displayed as each value is selected in the plugin output. It is possible however, to view the details of each value in the grid, but it requires the Details column to be unhidden. To do this, right click on the column headers and choose 'Column Chooser.'


The Customization box for the grid will be shown. From here, click and hold the mouse button on the Details column, then drag it anywhere you want in the grid.


This will then show the Details column in the main grid, like this:


Notice the information in the above screenshot is the same we saw above when the Details tab was shown next to the Type viewer.

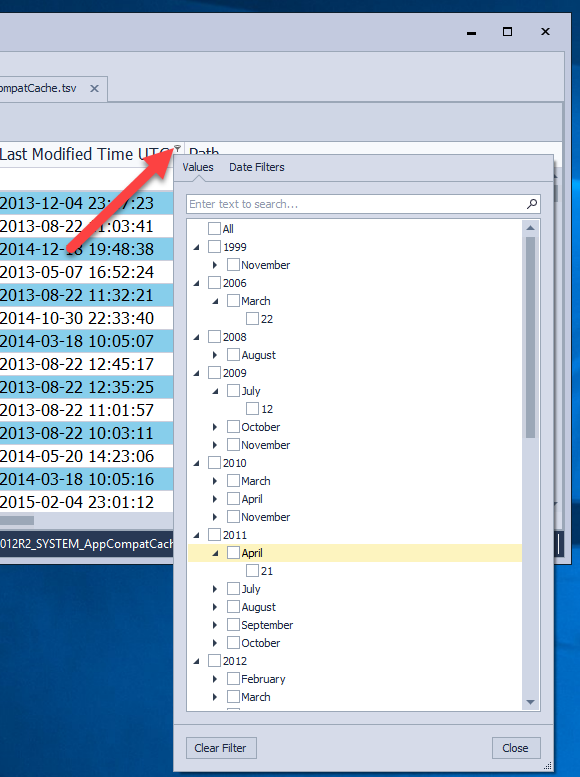
One reason you may want to show the Details column is that you can then filter on anything within it. Perhaps you are interested in any entries with an MFT entry number of 0x25C60. You can simply enter this value in the Details filter below the column header and any matching rows will be displayed, like this:


Here you can see the filter has returned one row, value 20, as being a match. Additionally, you can see the criteria used for the active filter and an Edit Filter button is displayed. These options allow you to toggle the filter (by checking or unchecking the checkbox to the left of the filter) or editing more complicated filters.

One thing to keep in mind is that it is NOT necessary to include the Details column manually before exporting. When plugins with details are found, the Details column will be automatically hidden before exporting the data so you will always have the Details in the Excel document.

ComDlg32 OpenSaveMRU

The OpenSaveMRU key maintains a list of folders and files, sorted by extension, that have been accessed. 

The OpenSaveMRU key contains a list of recently accessed folders. Below is an example of what the data under an extension subkey looks like:


Notice we have an MRU present as we have seen before.

When all of this information is put together by the plugin, we end up with the following (blurry sections not included):


We again have our results sorted in MRU order. The results can of course be sorted and filtered depending on your needs.

ComDlg32 OpenSavePidlMRU

This plugin works exactly as the OpenSaveMRU plugin does but we gain the additional details as we saw with the previous Pidl plugin. 


This is another plugin that has a Details column which is initially hidden.

Recent documents

This plugin works in a similar manner as the plugins we saw from ComDlg32 in that the main key has subkeys which contain values (including an MRU) that tracks recently opened files and folders.

All of the values are RegBinary and look something like this:


The RecentDocs key contains the most recently accessed items regardless of extension. Each subkey contains references to files with a given extension. There is also a Folder subkey that contains recently accessed directories.

When this plugin is finished processing all of the data, we end up with this:


This is a plugin that has benefited from community feedback. Initially this plugin was sorted by MRU and it was left to the analyst to use the data in the way that made the most sense to them.

Not too long ago however, a conversation happened on Twitter that caught my attention. Based on the back and forth between several people, I tweaked the output of this plugin.

Notice that the output is not strictly in MRU order like some of the other plugins we have seen. This plugin is designed to mimic the technique outlined by Dan Pullega which can be found here.

The idea is using the recent documents from the main RecentDocs key and the MRU position 0 timestamps (that work exactly as we have already discussed), a timeline can be built that lets you infer a range (and often a small range) of time a particular document was opened, even if it was not MRU 0 for a given extension.

For more details on this technique and why it works, please read Dan's post.

Thanks to Dan for the idea and for Juan/Phil/Eric's efforts at automating this process with their scripts.

RunMRU

This is a very simple plugin that turns this:


Into this:

User accounts

This plugin works against a SAM hive and correlates several different pieces of information together to build its output.

When the SAM\Domains\Account\Users key is selected, the following data is returned by the plugin:


This plugin works by looking at the subkeys under the Names subkey and correlating that information to the F and V values found under Users subkeys (other than the Names key). It extracts information from the F and V values and builds what you see above.

For full details as to how this plugin works, see the source code here.

TimeZoneInformation

This plugin is for SYSTEM hives and looks at the ControlSet00X\Control\TimeZoneInformation key.

This key looks like this normally:


After the plugin processes things, we get this:


When designing this plugin I found several references to how some of the values under this key worked on the Interwebs. As I started coding, I noticed that the resulting start and stop times matched something else I was familiar with seeing on a regular basis in X-Ways Forensics.

The image below is the information available in X-Ways Forensics for UTC-7, Mountain Time:


If we compare the daylight start and daylight end times from the plugin to what we see here, we can see the information matches (albeit in a slightly different format). Its always a good thing to validate your output!

UserAssist

The UserAssist key (and subkeys) will look something like this:


Notice that the subkeys with a GUID name contain a Count subkey. The values shown above are what we find in one of these Count keys. As you know, UserAssist value names are encoded using ROT-13.

This particular plugin is activated whenever a key matching this pattern is selected:

Software\Microsoft\Windows\CurrentVersion\Explorer\UserAssist\*\Count

Notice the * in there. This allows the plugin to process any of the Count keys regardless of which GUID is selected.

When one of these Count keys is selected, the plugin decodes the value names and extracts other bits of information from the value's binary data.


Here we can see the original, obfuscated value name and the decoded value. We also get a Run counter and, when available, a Last executed timestamp.

For people wishing to dive into how UserAssist works, there are plenty of resources available. =)

AppCompatCache

And last, but not least, we have the AppCompatCache plugin. This plugin is based on both a key, ControlSet00X\Control\Session Manager\AppCompatCache, and a value, AppCompatCache.

This value looks like this in its native form:


When the AppCompatCache value is selected, a new tab shows up next to the Type viewer, like this:


The output is very similar to what my AppCompatCacheParser program extracts.

That's it!

Whew! We made it to the end! You can get Registry Explorer from the usual place.

Enjoy and PLEASE let me know what other plugins you want.


Workflow overview

$
0
0
(This post is part of a larger post which can be found here. It has been separated out to keep the main post from getting too long.)

Workflow overview

There are two main sections, carving and searching, below. Each contains an overview of how each of those main operations is performed in Encase, FTK and X-Ways.

Carving

X-Ways

Like everything that affects the volume snapshot, the File header signature search is found under the Refine Volume Snapshot option.


Here the File header signature search option is checked.


After clicking OK, groups of file signatures (or types within them) are selected. Additional options to categorize or place carved files with their "parent" files are also available. X-Ways displays the most commonly used groups of things first and inside each group, the most common types are at the top. You can also type an extension to quickly jump to the first match.


After clicking OK in the File header search options, X-Ways starts carving and provides feedback on how many fiiles its recovered so far (+11 files) and the throughput. When carving is finished, X-Ways tells you how many files have been added to the volume snapshot as a result of last operation.


X-Ways places all of the carved files under a virtual folder named "Path unknown\Carved files." Clicking on this directory displays all of the carved items.


When X-Ways refines the volume snapshot, it keeps track of  how many new items have been added to the snapshot. To quickly see only the files that were added as a result of the last refinement, the Int. ID (internal ID) filter can be used. Notice that it defaults to the same number as we saw above and the highest option is selected. This means the newest 408 items will be shown as a result of the filter.


After filtering, the results look like this:


While this kind of filtering is not necessary, it is often very helpful to filter out everything but carved items for review.

Encase 8

From the Evidence tab, select Process evidence | Process:


Under the Modules section is the File Carver option. Double clicking on this brings up a list of categories and file types.


After selecting signatures and clicking OK, the job is queued. To review carved files, use View | Artifacts 


From there, look at the File Carver - Entries section


From here, review the carved files as needed.


The progress of each job can be seen under View | Processor Manager as well as the lower right 
corner (job name only). A progress percentage is shown under the Status column. When processing a case, it often went to 100%, then jumped back to a lower percentage, then rose again.


FTK

Select Evidence | Additional Analysis


Click the Miscellaneous tab, check Data carve, and review Carving options

The job is queued. When finished, the results can be seen on the Overview under File Status | Data carved files.


Searching

X-Ways Simultaneous search

Searching starts via an icon on the main interface or via the Search menu.


From here, keywords are entered one on a line. Options to the left allow for grep searches or even 'normal' and grep searches at the same time.

Code pages are also selected here as well as the type of search to do (Logical or index based) and the number of threads to use (from 1 per core to a max of 6).


After clicking OK, X-Ways shows files being processed, time remaining, and the number of hits so far. When finished, a summary is displayed.


The search results are then displayed and can be sorted or filtered in a variety of ways, including context around the search hit (i.e. does 'hardware' appear within 20 bytes of the search hit, etc). These results, along with context and highlighting, can be exported as needed.


X-Ways also allows for only looking at one or more search hits using boolean logic, 'near' searches (i.e. show only files where stefan is within 100 bytes of winhex), showing files with a certain number of terms in it (min 1, all 3, etc), and so on.


X-Ways will only show you the hits in files that are listed in the directory browser (as opposed to all hits everywhere). This is handy because if you want to only see hits for a given user's profile for example, you can recursively list only that user's home directory. Once this is done, the search hit numbers will be updated to reflect what is available in the user's folders.

Here only the 'Rotunda' hits are selected


and the resulting hits are then displayed.


Selecting a search hit shows the hit in file file with highlighting


Clicking on the Preview tab would show the file, if applicable, in its decoded state with the first instance of the search term highlighted. 

X-Ways Index search

To create the index, use the Refine Volume Snapshot option


Then select Indexing


Set preferences (the defaults are almost always right, but things like character substitution are very nice for foreign language related cases)


The index is then built and can be canceled at any time. When canceled, the index is completed up to the point where it was canceled as opposed to dropped entirely.


Searching against the index is done via the same interface as a Simultaneous search, but the dropdown at the bottom is changed from Logical to Index. Grep is still an option when using index search as well.


Reviewing the results is exactly the same as with the Simultaneous search


Encase Keyword searching

Select Evidence | Process Evidence | Process

Check the 'Search for keywords' module, then double click 'Search for keywords' title for options.

Click Add keyword list, enter one keyword on a line, and check the encoding options.


Select View | Search, then click the Keywords tab. From there clicking on a keyword shows the files with hits to the right. To see the hit in context, right click in the hex view and choose the appropriate option.

When switching to different files, Encase kept the same offset it previously had vs. selecting the first hit in the newly selected file. Compressed view helps alleviate this, but it still made review difficult.

Encase Index searching

Bring up the Process option as before


Check the Index text and metadata option, then double click it for options.


Once the job is finished, use View | Search | Index to interact with the index. As words are entered, matching strings from the index are listed. Clicking one of these words allows files with said word in it to be reviewed.


Index hits did not seem to allow showing the context of the hit like a keyword search did.


FTK Live search

Select the Live search tab, then check the encodings to use. You MUST check these before adding keywords as you cannot change them after they have been added. Click Search when done entering terms to queue the job


The job is queued. When it is finished, results will be shown to the right of the main FTK interface


Expanding the keyword search job allows for reviewing hits. Selecting a hit will show it in the File Content section. 


Unless there is a different interface to review hits, it seemed necessary to check in as many places as there were selected code pages. Unless there is a better way to review hits, it was difficult to review several hits at once.


FTK Index search

Select Evidence | Additional processing


Select the Indexing tab and check the appropriate boxes. I did not see options to adjust indexing parameters in the GUI.


The indexing job is queued.


Canceling an indexing job results in NO index being created at all.


To use the index, select the Index search tab, then enter terms to search for. To review search hits, double click an added term and the results are shown to the right.

As with live search, reviewing things was difficult due to the grouping.

Additionally, could not get FTK to show the hit in hex view by simply clicking on the hex tab. Had to search for it in the hex view after switching to that tab. Cannot lock view on hex tab either, so seeing native hits requires several additional steps.


Let the benchmarks hit the floor: Autopsy vs Encase vs FTK vs X-Ways (in depth testing)

$
0
0

Foreword

I know that there is no single tool that solves every problem. There are just too many use cases out there for this to be true. I hope people consider what it is they do on a day to day basis and keep an open mind as the numbers begin to flow. Hopefully the numbers and metrics below help push people past familiarity with a tool they use now to something that can work better for them.

I certainly have not tested every possible use case here. What I tried to do is test the "core" forensic requirements of dealing with images, processing said images, searching (both via index and "keyword" searching), and finally carving.

I realize everyone's processing and workflow is different, but IMO there exists certain core competencies in digital forensics that can be tested and compared: hashing images, processing a case, creating an index, searching, and carving.

As background, I started my foray into forensics with Encase 6 and got my EnCE. I also used FTK here and there when I was with the FBI. Prior to Encase 7 coming out, I started looking into and using X-Ways Forensics more, having been using WinHex for many years. I say this so that the work we are about to discuss cannot be summarily discounted due to my inexperience with a given tool or any other kind of deficiency when it comes to using a particular tool. The testing protocol I came up with isn't affected by one's efficiency with a tool. I wanted to measure what happens when the software is told to do something. Once this is initiated, it is pure timing of how long that something took from start to finish.

I have nothing to gain by any of the tools that have been tested coming out as number one. Other than being an (avid and vocal) X-Ways user, I am not compensated in any way by X-Ways. 

I feel this kind of testing is something the community has needed for a long time. I know why it hasn't been done in the past tho: it has been a significant amount of work to do! I did find some other benchmarks that have been done in the past, including this site which has a comparison between some of the same products I tested.

Another very important aspect of this testing is having a conversation about different tools, pros and cons of each, techniques, etc. In my experience, those who are most critical or dismissive of any given tool have often never used it for any amount of time (and usually, not at all).

Hanging on to a tool or technique because it is what someone started/familiar with makes little sense when there are hard metrics to consider, other tools that can enable more efficiency, etc.

Question your tools, look at the testing, contribute, and have an open mind. =)

Let's begin

NOTE: All of the raw numbers are available here in a Google Spreadsheet. This allows for quick sorting, filtering, etc based on just about all of the configuration options. All of the raw data for this is available here.

This kind of testing has been one I have wanted to do for years now.

The idea is basically to take Autopsy (to some degree), Encase, FTK, and X-Ways and test them in two ways:
  • Against themselves on different hardware using the same settings (Do they scale as you give them more resources? Do they perform the same when resources are taken away?)
  • Against each other in terms of speed of hashing, processing, searching, etc.

The first test is pretty easy. Does more hardware equal more performance? Does less hardware slow things down?

The second test will never be 100% possible as each tool is different, primarily in how it processes a case, searches, etc. For the second test, I have tried, as best as I could figure out, to have each program do roughly the same "stuff" when processing a case. The other things we will discuss are more apples to apples. Case processing is the one area where tools diverge in what they do.

When looking at the case processing times, consider what each tool is doing as it processes a case. I included screen shots for what each of the options does for each of the programs to make it easier to compare. The case processing testing is the hardest to definitively measure as each tool is doing things differently under the hood (some more, some less). I do not want this to get into an expose on all the extra stuff one tool has over another, but if you spend any time digging into the differences in these programs, spending time in how each tool processes a case will be the most beneficial (in my opinion anyways).

For example, in X-Ways, I did a "refine volume snapshot" and told it to calculate a hash, verify files by signature, extract metadata, process archives and email, and so on. In each of the other programs, I selected options that mirrored the items listed above as closely as possible in terms of what was selected. All of the settings in each program were documented and will be presented below as we get into things..

The contenders

  • Autopsy 4.1.0 x64
  • Encase 6.19.7 x64
  • Encase 7.12.1 x64
  • Encase 8 8.01.01 x64
  • FTK 6.0.3.5 x64
  • X-Ways Forensics 18.9SR5 x64

The hardware

I tested all of the software on a wide variety of machines, including VMs from Microsoft Azure, Amazon AWS, and several bare metal machines including several workstations, mini computers, and a laptop. The general specifications for each is below. More detail on each machine will also be available at the end of this post.
VM size
Provider
Cores
Memory
Storage
Max disk read speed
Cost/month1
i2.4xlarge
Amazon
16
122
4 x 800 (SSD)
200 MB/sec
2,848
d2.4xlarge
Amazon
16
122
12 x 2048
200 MB/sec
2,241
m4.4xlarge
Amazon
16
64
EBS
135 MB/sec
1,439
ERZ
NA
4
64
NVME
5500 MB/sec
NA
NUC
NA
8
32
NVME
2000 MB/sec
NA
CFA21
NA
32
96
SSD/RAID
2000 MB/sec
NA
Sager
NA
8
32
SSD
4000 MB/sec
NA
F2s
Azure
2
40
SSD
65 MB/sec
83
F16s
Azure
16
32
128 GB
530 MB/sec
1,321
GS4
Azure
16
224
128 GB
810 MB/sec
3,987
GS5
Azure
32
448
128 GB
1610 MB/sec
7,179
GS2
Azure
4
56
128 GB

996
GS1
Azure
2
28
128 GB
75 MB/sec
409
DS13_v2
Azure
8
56
128 GB
270 MB/sec
494

Information on the GS series VMs is available here and FS series here. DS series is available here. Amazon VM info is here.

My goal was to choose a cross section of VMs that ranged from entry level to uber level in order to take the hardware out of the equation. All the tools benefit (or suffer) from the same VM related properties/features as well as the bare metal configurations. Nothing was changed on the VMs or hardware for each piece of software tested.

The ERZ line is my workstation. It has an Intel NVME SSD drive for the C volume and a Samsung 850 SSD (with Rapid mode enabled) for the D drive. The CPU is an i7-6700K @ 4 Ghz.

The Sager line is my laptop. It has a Samsung M.2 drive for the C volume and a Samsung 850 SSD (with Rapid mode enabled) for the D drive. The CPU is an i7-6700K @ 4 Ghz.

The CFA21 machine is another workstation I have access to. It has several SSD based RAID volumes and some stand alone SSDs. The CPU is an E5-2698Bv3 @ 2 Ghz.

The NUC is a Skull Canyon based mini computer. It has two Samsung 950 M.2 drives in it. The CPU is an i7-6770HQ @ 2.6 Ghz,

All of the other configurations were as similar as I could make them (and will be documented in full detail below), but in general each had the OS provided hard drive, one or more temporary drives, and a 4 TB spanned volume that was made by combining 4 SSD based 1 TB drives together. In reality spamming a bunch of drives did not make a difference speed wise. The disk benchmarks show this as well, but I kept things consistent and used a spanned volume throughout.

The only exception to this rule was the addition of another 2 TB spanned volume that was again made up of 2 1TB SSD drives. This was dedicated to the FTK database. The database software as well as the data itself were directed to this dedicated drive.

The 4 TB volume was only used to store the image file used for all of the testing.

When a tool was being tested, nothing else was being done on the machine. In other words, each tool had full access to the resources on each box as opposed to running two tools at the same time, streaming video, CounterStrike, etc.

More details on the test configurations are available in a Google Doc and can be found here. This document also contains all of the raw benchmarks, notes, etc. from all the testing.

Testing image

I used the xp-tdungan-c-drive E01 from SANS 508. The E01s are approximately 6.5 GB in size and are roughly 18 GB uncompressed.

Anyone who has taken SANS 508 or played NetWars has the same image, so it is available for comparison by anyone who wants to test and provide results back to me.

I chose this data set intentionally as it is in wide circulation as opposed to some proprietary data set that I could not share. I hope that many others who have the test image will test their own hardware (or let me ideally) so the results can be added to the testing data.

Program configuration

Aside from changing where the programs look for different things, I tried to leave each program as close to their defaults as possible.

In other words, I didn't tweak X-Ways and/or Encase to run really well with optimized settings but gimped FTK with settings I knew would not work, etc.

The reason I tested the defaults is this is how the vendor shipped the product and I am going under the assumption the defaults should be correct for most people (if they are not, then why are they the defaults?). I have not done any tuning or tweaking of any external processes or programs, etc. I installed the app, set some paths, and started using the software. I did not add anything to any of the installs (Enscripts, etc), nor did I take anything away (with one exception: I added additional carving signatures to FTK seeing as how it only ships with 13 signatures).

With that said, if anyone out there that feels they have a more optimally set up instance of X-Ways, FTK, Autopsy, and/or Encase they can make remotely available via TeamViewer, I am more than happy to work with you to do similar tests on your hardware. I would provide the image and run through my testing on the provided machine and would run X-Ways on it as well for comparison on another piece of hardware known to work well with Encase/FTK. I sincerely hope someone takes me up on this so we can have yet more data to compare. Testing should take no more than a few hours.

When possible, the same options were used in each program. For example, several tools allowed for configuring the maximum word length when creating an index. When this was possible, the same value was used in each program for consistency. In some cases I tested the default index length and documented how long it took as well.

Autopsy 4.1.0 x64

Program installation directory: C:\Program Files\Autopsy-4.1.0
Cases directory location: C:\autopsy
Temporary directory: D:\
Images directory: E:\

Encase (all versions)

X denotes version number

Program installation directory: C:\Program Files\EnCaseX
Cases directory location: C:\Users\eric\Documents\EnCase
Temporary directory: D:\
Images directory: E:\

FTK 6.0.3.5 x64

Program installation directory: C:\Program Files\AccessData
Cases directory location: C:\ftk
Temporary directory: D:\
Images directory: E:\
Database directory: F:\

X-Ways Forensics 18.9SR5 x64

Program installation directory: C:\xwf
Cases directory location: C:\xwcases
Temporary directory: D:\
Images directory: E:\

Workflow overview

This post covers general workflow steps for carving and searching for Encase, FTK, and X-Ways.  It is a separate post to keep this one more reasonable in size.

Overall benchmarks by program

The initial round of benchmarks included testing each VM's hard drives using AttoBench. From there, X-Ways was tested on every VM as a byproduct of these tests. When testing first began, I did not have what I needed for Encase, FTK, etc. Once the initial metrics were gathered as far as disk speed, memory and CPU cores, I took at look at all the VM types and selected several that gave a good spread across the scale, from low end to high end. This is why you will see so many more machines listed for X-Ways testing than for the others.

The primary thing I learned from this initial round of testing is that read speed from the disks did not affect most of the tool's performance in any meaningful way.

During this initial testing, it was interesting to see how far DOWN the hardware scale I could go and not drastically affect X-Ways' performance. I stopped looking at VMs when I got to a 2 core machine with 28 GB of memory.

One thing to note is that in most of my initial testing, Encase 7 and 8 were pretty close in terms of performance. Because of this, I only tested Encase 8 on most machines. As a result, Encase 7 was tested on a small subset of configurations.


For each of the tools below, screen shots of the case processing options are shown in order to compare what it is each tool is doing (or at least from what is controlled by the end user).

X-Ways 18.9

Case processing options


One thing to note here is how much "stuff" is done for metadata extraction and archive processing. One thing X-Ways also does by default is generate a timeline as it looks at all the items in a case. This timeline includes events from a wide variety of sources including the file system, event logs, email, browsing history, etc.

Index settings

Default settings were used with the exception of the max number of threads. Testing was done using a variety of thread counts and the results will be shown below. 5 to 7 seemed to be the sweet spot.

Search

Benchmarks

Resources on all machines were around 228 MB of memory
All times are denoted in minutes:seconds format

Grey blocks below can be inferred by looking at similar times from other VM configs


GS5 had rw disk cache, GS4 just read

1- Did tests using throughput optimized (st1) and general SSD storage (gp2). Scores are gp1 then st1
2- Used non-SSD drives and striped two 1 TB drives
3- Tested with four non-SSD drives striped

Encase 6

Initially, the Encase 6 installer complained about an unsupported operating system. I needed to install Encase 8 to get Hasp drivers for Windows Server 2012R2, then Encase 6 worked. 

Case processing options

Mount all compound files by extension (all selected)

Modules
  • Logfile
  • Exif
  • Lnk file
  • Windows event log
  • Windows case initializer
During case processing, CPU sitting around 12.8% and 110 MB of memory

Index settings

Memory usage was around 1,600 MB

Search

Memory usage was around 81 MB

Benchmarks


F1 – did not have Enscript to search index.

Encase 7

Encase was using upwards of 5,000 MB of memory with case open

Case processing options

Index settings

Benchmarks

See Encase 8 testing for times where blocks are grayed out below

F1- Did not see a way to search for all terms at once in index. Had to do them one at a time (and add all the hits up manually)

Encase 8

Encase was using around 5,800 MB of memory when the case was open

Case processing options

Index settings

Memory usage was up to 15,900 MB during indexing on some VMs.

Search

Memory usage was up to 4,500 MB on some VMs

Benchmarks


F1- Did not see a way to search for all terms at once in index. Had to do them one at a time (and add all the hits up manually)

*  Searching for all 34 keywords took 4 minutes and 55 seconds
** Did a second index creation test with default max length of 64 characters. Time was 16 minutes, 15 seconds.

FTK

In addition to the standard hardware on all other VMs, a spanned volume of two, 1TB hard drives was added and dedicated to the database.

Case processing options

Memory usage was around 850 MB.

Expand compound files additions: skype sqlite, ie webcache, firefox sqlite, firefox cache, evt, evtx, chrome cache, chrome sqlite

Index settings

Memory usage was around 3,000 MB (depending on machine) and CPU was 95-100% regardless of VM. 

Search

CPU near 100% memory around 500 MB

Benchmarks

* ANSI only keyword search took 5 minutes and 31 seconds. Time above is for ANSI and Unicode (same as all other tests)
 ** Had to push temp file to database directory since temp drive was only 8 GB and FTK wanted 50GB

With the exception of the really low end VMs, having many CPU cores and memory did not speed things up in a manner consistent with the increase in hardware resources. 

Autopsy

Memory usage was around 813MB with case open

Case processing options

Using around 1,000 MB of memory during case processing

Index settings

Not applicable

Search

I found using keyword searching difficult in that I could not really tell what was going on to include when a search started, when it ended, and so on. There are also no indicators for timing in the "Ingest messages" window that shows activity other than hits.

Benchmarks


??? I missed manually watching the GS5 results. Based on other results, I would estimate it was close to the 24 minute mark.

IEF

Left all options at their defaults.

Benchmarks


IEF was sitting around 80% CPU and using 2,000 MB of memory while processing.

Hashing comparison

This table summarizes each of the program's abilities to verify the test image on a few configurations.

All times in minute:second format


All of the hashing times are available in the spread sheet linked above. Just sort by the Hashing column and filter as needed by machine type.


Detailed searching comparison

Since searching is so important I did some dedicated testing of a few scenarios.

It is important to understand how a tool searches data as well as what an examiner needs to do in order to be sure the data is being searched thoroughly.

Search options by program

X-Ways

There are two ways to search in X-Ways, the Simultaneous search (SS) and an index search. It is not required to do both when searching and more often than not, an SS is all that is needed.

FTK

From what I understand, both an index and a live search are required to ensure all data is covered. If this is not accurate. please let me know. 

I base this statement on a question I asked Tim Leehealey, Chief Evangelist of Accessdata, on the Forensic Lunch. This can be viewed here and most importantly here. I am the "Mike Stammer" David mentions. It is worth a listen for many reasons.

I also had some discussions on Twitter about indexing and searching in FTK, including doing a poll. The results of that poll look like this:


There were also some interesting findings related to how FTK indexes. The general concensus (which is backed up by my testing and will be explained below) is that FTK only indexes Unicode strings. Because of this, it is even more important to do a live search in order to find all non-Unicode encoded strings. As we will see, this means many hours will be added to processing a case.

Encase

From what I understand, both an index and a keyword search is required to ensure all data is covered. If this is not accurate. please let me know. There was some chatter about having to process a case, mount compound files, etc. as well so that searching worked properly.

Autopsy

Autopsy was interesting as it didn't seem to have two distinct modes. It build the index as it searched for keywords. 

Test one

In the first test, I searched for the following words:
  • x-ways
  • winhex
  • stefan
  • peter
  • mouse
  • hack
  • wizzo
  • eric
  • zimmerman
  • Michele
That search ended up looking like this (Top line is total hits with breakout of each term below):

Program
Search hit count
Index hit count
X-Ways Forensics
315,070 (simultaneous search)
x-ways    0
winhex    0
stefan88
peter 1,479
mouse78,645
hack6,536
wizzo1,028
eric227,246
zimmerman23
Michele 25

274,079

x-ways    0
winhex    0
stefan82
peter 1,319
mouse61,530
hack3.674
wizzo1,028
eric206,398
zimmerman23
Michele 25
Encase 6
316,476 (Keyword search)
x-ways    0
winhex    0
stefan88
peter 1,462
mouse78,721
hack6,525
wizzo1,028
eric227,091
zimmerman23
Michele 25

NA
Enscript to search index missing
Encase 7
Not tested, see Encase 8

Encase 8
16,084 (Keyword search)
x-ways    0
winhex    0
stefan90
peter1,506
mouse79,452
hack6,579
wizzo1,028
eric227,381
zimmerman23
Michele 25
38,579
x-ways     0
winhex     0
stefan50
peter884
mouse23,821
hack2,721
wizzo      0
eric1,105
zimmerman31
Michele 182

FTK 6
132,304 (Live search) *
x-ways    0
winhex    0
stefan90
peter1,505
mouse61,245
hack5,775
wizzo400
eric63,241
zimmerman36
Michele 12
14,458 (1,635,265 with false positive)
x-ways    1,620,807
winhex    0
stefan30
peter 435
mouse12,823
hack  686
wizzo       0
eric456
Zimmerman 9
Michele 19

Autopsy 4.1.0
5,844 (Keyword search)

NA
Doesn’t seem to differentiate between the 2

* Limited FTK to 200 max hits per file, which is the default setting.

Some notes related to this first test:
  • Encase processed xpi, ja, pak, xap etc. files whereas these are ignored by default in X-Ways. X-Ways can include these files as needed. Including several of these extensions brought up the numbers closer to a match, but without verifying everything manually it is assumed the same type of thing is the reason for the discrepancy
  • Index only for words up to 7 characters in length when program allowed that option

Test two

In test two, I added these words to the above list, for a total of 18 terms:
  • Framework
  • Child
  • Salad
  • Balsa
  • Bomb
  • Technical
  • Dislike
  • Rotunda

Test three

Finally, for test three, I added these words, for a total of 34 search terms:
  • Missile
  • Blueprint
  • Grapefruit
  • Stingray
  • Beam
  • Zebra
  • Salacious
  • otter
  • blinky
  • treadstone
  • washboard
  • technical
  • schematic
  • vibranium
  • shield
  • star
These tests were done using more search terms to see how search time scaled when adding more terms. All tests performed on the same VM (GS5). Searches were using either one thread (for X-Ways) or the default for the program (unknown thread count. If anyone knows, please let me know).

In each case, any previous search results were discarded before searching again.

Search test results

Time listed is minutes:seconds or hours:minutes:seconds.


In each of the tests, X-Ways was the fastest and used the lowest amount of resources.

When looking at Encase 6,7/8 results, X-Ways was 1.8-4.5.2 times faster for 8 terms, 1.7-4.7 times faster for 18 terms, and 4.1-4.7 times faster for 34 terms.

When looking at FTK results, X-Ways was 45.7 times faster for 8 terms, 77.1 times faster for 18 terms, and 126.5 times faster for 34 terms.

X-Ways has the ability to use more than one thread for a simultaneous search (one per core, up to six threads total). If we compare things based on how long it took X-Ways to search when using six threads for 8 keywords (0:33 seconds), 18 terms (0:35 seconds), and 34 terms (0:49 seconds), we end up with the following:

When looking at Encase 6,7/8 results, X-Ways was 12.6-14 times faster for 8 terms, 12.5-14.5 times faster for 18 terms, and 10.2 times faster for 34 terms.

When looking at FTK results, X-Ways was 138 times faster for 8 terms, 250.1  times faster for 18 terms, and 364.1 times faster for 34 terms.

To summarize in handy chart form:

ANSI vs. Unicode comparison

As mentioned above, FTK seems to only index Unicode encoded strings. It may also add ANSI encoded strings to the index if a file is entirely ANSI, but anything mixed will be Unicode only. I tested this by looking at hits in X-Ways (which indexes up to 6 code pages at once) and filtered for ANSI and Unicode encoded hits. Some of the comparisons are as follows:

Carving test

The purpose for searching for one signature up to the maximum is to gauge a program's ability to scale with the amount of data signatures being used. While it rarely, if ever, makes sense to just "carve for everything," it does provide a means of comparison as the number of signatures increases.

Carving tools should strive to find usable data as quickly as possible. It does an examiner very little good to “find” 300,000 files when 299,932 of them are not usable. When this happens, it only serves to create more work for an examiner to work through the noise of false positives. As such, in the testing done below, it is more informative to look at how long carving took as signatures were added vs comparing the number of files recovered.

This test measured how long each tool took to carve common formats. Little to no comparison of the results from each tool was done (i.e. did the tools recover valid files, etc.). NIST has done testing as to the quality of data returned by some of the programs tested. Several others have tested many different tools as well and calculated many additional statistics on file recovery as well.


This set of tests was on a much more limited set of hardware. Specifically, I only tested it on DS13_v2 and GS5 VMs in order to see if more resources resulted in faster carving times and how each tool scaled when adding more signatures to look for.

FTK includes the following carving options: Zip, Tiff, Png, Pdf, Ole files (MS Office), Lnk, Jpeg, HTML, Gif, Eml, Emf, Bmp, and Aol bag files. 

X-Ways Forensics includes over 330 different file types, all of which are defined in a plain text file. Each of the types above were included in the X-Ways carving signatures.

Encase 8 includes 329 different file types which are configurable in the GUI.

All of these tests were conducted on the GS5 and DS13_v2 VMs.

The following tests were conducted:

Time is in hours:minutes:second format, followed by files recovered count

Carving notes

FTK ships with a minimal set of signatures. A list of additional carving signatures is available at https://support.accessdata.com/hc/en-us/articles/203423159-Custom-Carvers.  For the "All supported signatures" test, the ‘Windows Carvers’ (70 signatures) and ‘Other carvers’ (140 signatures) were imported and any duplicates/existing signatures were ignored. The MFT record carver was also imported.
Carving with these 223 signatures (and all the included ones as well) took 45 minutes and 16 seconds. FTK carved 138,313 files. CPU usage during carving was 98-99% across all CPU cores.
In reviewing jpegs recovered by FTK vs. X-ways, many of the additional items recovered by FTK were 1 pixel wide and/or very low byte count. X-Ways includes several options to reduce “irrelevant” information and it is possible the properties of the jpgs is one of criteria used to determine this.
Carving in Encase is difficult. I found it very convoluted to set up and then view results. In the five signature test, Encase produced a lot of unreadable files. It also said zip files are viewed internally when I double clicked one, but didn’t offer to let me view it internally. In fact, most files recovered had a logical size of 4096 (the size of a cluster in the image) and wouldn’t open at all.
It is also worth noting that no version of Encase actually finished carving for all signatures. The program had to be forcefully killed to recover.
NA- Encase 6 did not seem to include an Enscript included that allowed for carving


* Had to task kill Encase to recover. CPU was idle at 0% while using 5100 MB of memory for hours ** X-Ways has a “Special Interest” category of things that are more expensive to carve for. The time above includes searching for these item types:

  • Google Analytics URL+ei TS
  • Zip record
  • Firefox(2)
  • Firefox cache
  • Base64
  • Information Summary
  • TCP Packet
  • UDP Packet
  • VISA/Mastercard
  • Gigatribe 2.x state file
  • Gigatribe 3.x state file
  • Gigatribe 2.x chat
  • Gigatribe 3.x chat
  • Unix kern.log
  • misc log files
  • Gatherer fragm
  • CD Volume Descriptor
  • Gateway php
  • Palmpilot
  • Photoshop thmb
  • Spotify Playlist
  • SQL
  • XML fragment
  • Comma separated
  • Windows.edb fragment
  • Bitlocker rec key

These options require another level of confirmation in X-Ways but both are included here to be as thorough as possible.

Total processing time summary

The following list of times represents the time it would take to hash, process the case, create an index, and search (using 1 thread or the default). All times taken from the DS13_v2 VM.


GS5 default case processing test

This round of testing took each tool and processed the image using all of the program default options to process said case. It was done on the GS5 box since it was by far the biggest in terms of resources.

X-Ways

By default, X-Ways does not have any processing options selected. However, the small box on the left, when checked, selects the items shown below. Notice the indexing option is unchecked. Since FTK and Encase index by default, two runs were done, one without indexing (the default), and one with indexing enabled.

Defaults: 4 minutes and 7 seconds

Defaults + indexing: 8 minutes and 34 seconds

In comparing the defaults for FTK and X-Ways, X-Ways default settings as shown below include Entropy testing, metadata extraction, and browser history whereas FTK does not select those initially. 
Running these items in FTK took 1 minute, 25 seconds.

X-Ways also automatically built an event timeline with 1,084,841 items in it in the times indicated above.
C:\Users\e\AppData\Local\Temp\SNAGHTMLf87f47b.PNG

Index with 18 terms

The default for indexing in X-Ways is 4-7 characters. This can be extended to include more or less from the indexing creation interface, with the downside being longer creation times and index size. With these minimums, any word containing fragments of words up to the maximum length are still found. For example, ‘Technical’ is 9 letters long, but X-Ways, by default, will only index ‘technica.’ However, X-Ways will hit on ‘Technical’, ‘technicality’, or ‘technicalness’ and as such, hits are still found. For exact hits on an exact string longer than the maximum, one can quickly filter when reviewing search hits. Time: NA Hits: 432,901

Simultaneous search for 18 terms

* Unique file name count only 

Time: 41 seconds

Hits (ANSI count/Unicode count): 553,966
** X-Ways searches through all items in the volume snapshot, even derivative items such as browser history reports that are added to the volume snapshot. These can be filtered out if needed. In this cases, the term "x-ways" was found in the HTML reports for browser history.

ANSI Only

ANSI only forced the “Decode in text” option to be disabled as Unicode is required for this feature. With this option disabled, some of the counts are off from the ANSI and Unicode results as some of the ANSI search hits came from “Decoded text” hits from the “Decode in text” options. For this same reason, ANSI hits + Unicode hits != ANSI and Unicode hits above.

Time: 33 seconds

Hits: 426,628

Unicode only

Time: 30 seconds Hits: 126,870

FTK

Processing time: 9 minutes and 1 second

* FTK found hits in unallocated space and considers each one a ‘file.’ This is present throughout the ‘Number of files’ counts

Reviewing live search and index searches is very difficult to do as there is no sorting or filtering of results that I saw.

Index with 18 terms

** This is a false positive as there are no instances of ‘x-ways’ in the image. Recall X-Ways only found instances of the term from files it added to the volume snapshot as it processed other artifacts and generated metadata about them.

Time: NA

Hits: 113,522 (without false positive)
There are far more results from the live search than an index search. This seems to make it necessary to do both an index and live search to make sure nothing is missed.

Live search for 18 terms

ANSI and Unicode

First attempt to search had to be canceled after 3.5 hours. After cancelling, at least some results were available.

Time: ??

Hits (ANSI/Unicode): 370,034/120,103 (490,137)

ANSI only

Time: 14 minutes and 41 seconds

Hits: 385,607
Unicode only Unicode search took much longer than ANSI. The first attempt to search had to be canceled after 1 hour, 15 minutes. After cancelling, at least some results were available. A second attempt was made, but was canceled after 45 minutes. The results returned are less than the 1 hour, 15 minute search. A third attempt was made and was let to run to completion. It took 3 hours, 3 minutes, and 18 seconds. In order to determine of the “Max hits per file” was responsible for the lengthy search, this value was reduced to 200. (A new case was also created and an ANSI + Unicode search was done to make sure it wasn’t something with the case. This search took 3 hours, 29 minutes, and 47 seconds). Time: 3 hours, 3 minutes, and 18 seconds. Hits: 120,103 (canceled at 1 hour 15 minutes)
66,174 3 hours, 3 minutes, 18 seconds (allowed to complete)


The hit count for the first canceled run (1 hour and 15 minutes), on several occasions, is higher than when the search was allowed to complete (3 hours 3 minutes 18 seconds). To verify the findings, the same search was run again (using ‘max hits’ value of 200 again).

This search took 3 hours, 2 minutes, and 48 seconds. The hit counts matched that of the other 3 hour, 3 minute search noted above.

Finally, another search with ‘max hits’ set to 5000 was done to see if this was the source of the initial discrepancy. This search took 3 hours, 6 minutes and 42 seconds. Comparing the number of hits to shows a discrepancy for the following terms:

Mouse = 16,390
Hack=887
Eric=39,623
Framework=51,343
Child=14,517

Based on this result, the first canceled search (canceled at 1 hour and 15 minutes) also used a ‘max hits’ of 5000 and this is why some of the hit counts for the second canceled search, which used a ‘max hits’ of 200, are higher.

All FTK standard options were used

Encase 8


Defaults took 11 minutes and 34 seconds.

Due to not being able to aggregate data in Encase when reviewing index and keyword hits, I did not total up what was found based on the default settings. To compare numbers with other tools. see the dedicated Searching section above.

Encase returns each search hit and the number of items for each term but provides to way to select more than one, copy the numbers out, export the numbers out, etc. As such it was far too much work to do this again (which was done manually for the Searching section).

Keyword search


ANSI and Unicode

Search took 5 minutes and 42 seconds.

Hits: 621,508

ANSI only

Same settings as above except Unicode unchecked

Search took 5 minutes and 32 seconds

Hits: 492,998

Unicode only Same settings as above except ANSI unchecked Search took 4 minutes and 59 seconds Hits: 128,510

Wrapping up

Well, that's it! I hope you found it useful and I hope it serves as the beginning to something bigger that the community can contribute to.

Please hit me up in the usual places with comments, concerns, etc.

Thanks for reading!!


JLECmd v0.9.6.0 released

$
0
0
A few days ago, Guillermo Fritz contacted me stating he found an automatic jump list that had more directory entries than what was showing up in the DestList section.

When the jump list in question is loaded in Nirsoft's JumpListsView, 589 directory entries are shown, but JLECmd was only showing 12 entries as reported by what was tracked in the DestList.

Here we see the Nirsoft tool's output


and here is what JLECmd v0.9.5.0 shows:


Looking at the jump list in my IDE shows us there are 591 directory entries in this particular jump list:


The reason the Directory count above is 591 is because of the Root Entry and DestList items, so if we take away those two, we end up at 589 remaining items in the Directory, 12 of which are accounted for in the DestListEntries collection.


I then added functionality to JLLECmd to detect and report this condition, as seen here:


This warning also appears at the bottom of the output.

When the --withDirs switch is used, the additional directory entries are listed in the output:


You can of course use the other switches to dump full lnk details, export these to CSV, and so on.

Here we see the default export of the 12 entries in the DestList:


And here we see the export when using --withDir:


Notice how there is a note about where the line came from as well.

Dumping all the lnk files out of the jump list via --dumpTo gives us a total of 589 lnk files as well:


While this seems to be a rare occurrence (I did not see this happen in any of my dozens of test jump lists), when you do run into it, it can be very valuable to get all the details contained in the jump list.

If you have a decent collection of jump lists, please run the new JLECmd against them via the -d and -q switch to quickly see if you have any that look the same as what was discussed above. If you do, test your other jump list tools as well.


Benchmark followup: Big(ger) data and Raw vs E01

$
0
0
As requested on the Forensic Lunch and elsewhere, I have done some additional testing to see how a few of the tools handle larger data sets (122 GB E01) and raw images vs E01.

Since I added another data set and another image format, I slightly adjusted the spreadsheet Data Size column. It now has the format of "Compressed size/Uncompressed size/Free space"

The spreadsheet is also updated with these numbers.

Large data set

This test consisted of using data from a recent case which was a 122 GB E01 image. The idea was to see if FTK and X-Ways (the two tools I was tasked to test in this regard with my employer) to see how the tools scaled to larger data sets.

These tests were conducted on the CFA21 box.
When it came to search hits, things look like this:

Where Delta is the difference between X-Ways hits and FTK hits.

Raw vs E01

I used the same data set as the original testing for this and just converted the E01 image to a raw image using X-Ways.
Blank spaces indicate this test was not run Green background indicates the faster image format

The X-Ways Raw test on ERZ was done using version 19b1.


ShellBags Explorer v0.8.0.0 released!

$
0
0
Hello! This release is long overdue!

NOTE:All of my software is now digitally signed starting with this release going forward. Most of my other programs have also been signed (but not necessarily changed beyond that). Redownload as needed if you want the signed versions.


Last Friday Dave and I spoke about the new version on the Forensic Lunch. Be sure to check it out for more details and to see it in action!


First, let's look at the changelog:

NEW: This is a complete rewrite using all new controls including newer and more capable tree and grid. Allows for better
filtering, grouping, etc. With this change, SBE has the same look and feel of Registry Explorer
NEW: Updated hex viewer and data interpreter
NEW: Updated icons throughout
NEW: Added Legend to Help menu
NEW: Added Options dialog
NEW: Added skinning
NEW: Completely updated manual to reflect new version
NEW: Added new GUIDs and new extension block types
NEW: Added ability to automatically report unknown GUIDs, shell IDs and extension blocks for reversing and inclusion in
future releases
NEW: Added Details form which allows for viewing all available details regardless of the columns shown in grid view

CHANGE: Time zone moved to Options dialog
CHANGE: SBECmd internals reworked to simplify logging and make command line options consistent with other
software

FIX: Added CD file system indicator vs showing FAT for optical media

Diving in

For the most part, things will look and feel the same as far as program layout and how it is used. Let's hit the highlights.

Icons updated and Legend added

To make things more consistent, most of the icons have been tweaked. A list of all the icons and their meaning is available via the Help menu.


Deleted/recovered shellbags are also now shown in red as opposed to having an X after them as in previous versions.

Here is an example of the new icons in action.


Filters and searching improvements

ShellBags Explorer now uses the same 3rd party controls as Registry Explorer and, as such, adds a lot of functionality that didn't exist in the previous version. Changes include being able to filter on the tree, search via CTRL-F, Excel-like filters on the grid, conditional coloring, and so on.

Here we see an example of the new Excel-like filters. This allows for selecting items based on their name and also allows for searching through unique options.


Here is another example of the new filter for a numeric value.


Right clicking on a column header in the tree or grid brings up a context menu allowing for a lot of different options.


Both the tree and grid support searching across all fields. Find is invoked either via the context menu of a column header or via CTRL-F. In the example below, a search for 'or' was done. All instances of matching values are highlighted.


Finally, conditional coloring is available both for the tree and the grid. In the example below, any values that contain 'code' are shown in bold, red font with a red background.


The tree works the same way.


The rules manager allows for a wide variety of formatting options.


Details window

In many cases, there are too many columns for all of them to be shown in the grid at the same time. As the interface is customized to your liking, there may be times when you need access to other columns. 

The Details window allows you to see all available columns regardless of the status of the grid. In the example below, several columns have been hidden but all of the details are available as needed in the Details form.


The Details form is updated as shellbags are selected in the interface.

Options

Options have been consolidated in this version and several new options have been added.


The first option, Show parent tree nodes when filtering, controls whether parent nodes are included when filtering in the tree. By default, only nodes matching a filter are shown, like this:


When this option is turned on, the same filter would look like this:


There are pros and cons to each approach. Generally, the default is what you want because once you filter down to what you are interested in you can quickly select the matching nodes to see what child bags exist, look at details, etc.

In the previous release, all of the columns would be auto-sized in an attempt to show as much detail as possible. This, however, often lead to columns being too small to display the information contained therein. The Show horizontal scrollbar on grid option, when checked, will resize each visible column to show the widest content available. When necessary, a horizontal scrollbar is shown. 

The DateTime format and time zone options are self-explanatory and of course, persist between program restarts. The active time zone is also now displayed in the status bar as a reminder.

Finally, unknown GUIDs, shell IDs, and extension blocks can be automatically submitted for reversing and inclusion in future releases. See the manual for more details, but in general, the only information submitted are the bytes necessary to add support for the unknown items.

SBECmd

The only changes here are some command line switches being renamed in order for SBECmd to be more consistent with my other command line tools. New options look like this:


You can get version 0.8.0.0 at the usual place as well as Chocolatey (pending package approval)

That about does it for this release. I hope you enjoy it!


ShellBags Explorer 0.9.0.0 released!

$
0
0
This is the biggest and most comprehensive update for ShellBags Explorer to date. While the change log may not be lengthy, there are significant and important changes and optimizations in many of the changes.


NEW: Added support for Windows backup related shellbags. These are populated as backup sets are navigated
NEW: Completely redone support for MTP devices, storage, and folders
NEW: Extraction of subshell items and other data from property stores of type STREAM, VECTOR, and BLOB. This results in MUCH more detail being available when these types of items exist in property stores (often related to Search results, etc)
NEW: Add support for many new shellbag types and extension blocks
NEW: Added Option to show/hide the hex value of shellbag in Details pane

CHANGE: Renamed First Explored to First Interacted and Last Explored to Last Interacted
CHANGE: Lots of unit tests and refactoring

Newly discovered items

Many new shellbag types and extension blocks were found as a result of the last build being released. Moreover, many new GUIDs were reported. These GUIDs were researched and when they could be related to a folder or Windows functionality, added into the list of GUID mappings. The current list is at 425 unique GUIDs!

This release also sees separate classes for each shellbag type. In previous versions, similar types were handled by the same class, but this new approach allows for fixing issues related to individual shellbag types easier.

Unit tests and refactoring

The biggest and most important change in this release is in the unit tests and the corpus of data used to ensure things are working properly.

Over the last several years, I have collected a wide range of Registry hives. To take advantage of all of the data inside these hives, I wrote a program that extracts all the shellbag data from each key under BagMRU, identifies the type, then hashes the results to make sure duplicates are removed. All unique files are stored under a directory named for the shellbag type (offset 0x02). Some types of shellbags, like MTP, zip, and those related to optical media, can be found in several different shellbag types. Because of this, the program checks for these special signatures and categorizes them accordingly.

The result of this program is shown below.


All told, over 65,200 unique shellbags exist in my test data.


As you can imagine, when I first pointed the existing code from the ShellBags Explorer project against this new data set, there were plenty of tests that didn't pass.

Once the tests were set up however, refactoring can begin to ensure proper parsing of all the newly available test data from our extraction above. This work resulted in some general tweaks for certain types, but for others, far more extensive work was done, up to and including completely rewriting code for shell items such as the various MTP bags (more on this later), entirely new extension blocks, and newly discovered shellbag types.

After a whole lot of work, the end result is this:


Now that a robust set of tests exist, any new data that gets reported can be easily incorporated and the code updated to handle the new data, all without worrying about breaking any existing functionality.

Another area where refactoring happened was in property stores. Property stores are very common in shellbags and are used to contain key/value pairs. There are several key types that can contain binary data, particularly STREAM, VECTOR, and BLOB data. These types of data in property stores often contain other shell items, data related to searches, and much more. This release adds support for native parsing of some of these types of data (more will be available in the next release as well).

Prior to this release, additional data was harvested from these data types by using regular expressions to search for extension block signatures. As such, some of the data was already available in previous versions. The main difference in this version is the association of these extension blocks with their parent shellbag data (think of it like a Russian nested doll, or a shellbags Inception movie plot). The initial shellbag can contain property stores which also contain multiple shellbags which also contain property stores which also contain shellbags, and so on.

By drilling down into all available data (and parsing all of the data available), a more accurate picture can be painted and new research can be conducted to find new and valuable uses of shellbag data.

As far as I know, none of these structures is/was documented prior to this version of ShellBags Explorer.

MTP devices

This work started off based on the excellent work of Nicole Ibrahim which can be found here. Nicole did a lot of work mapping out the properties of MTP related devices, storage, and folders. This work was the basis of my initial rewrite.

Because of the large amount of test data I had, I quickly ran into cases where the initial work was not parsing things correctly. At this point, I stepped back and extended things to get all my unit test passing.

Once the code was parsing all of the data correctly, additional research was done in order to make sense of all of the different kinds of data contained in these shellbag types. In many cases, the data is stored in a key/value relationship and the value is of a certain type, like Unicode string, boolean, timestamp, etc. After looking over documentation compiled by Joachim Metz and other Microsoft data (some of which was provided by Nicole again), I was able to validate the findings from Nicole's earlier work and extend the data types to a more usable format as will be shown below.

Prior to this version, only the low hanging fruit was being extracted from MTP related shellbags.

Here are some examples from version 0.8.1.0:

First, an MTP device:


Next, MTP storage:


Finally, an MTP folder:


Now let's look at the same usrclass.dat hive in version 0.9.0.0:

Here we see the MTP device. Notice we have a much more complete picture of the data available inside the shellbag.


Next, MTP storage:


Notice how every key/value pair is now extracted and represented. This results in a significant increase in information about a particular device and its capabilities.

Finally, the MTP folder:


Here we see the same concept as the previous example in that all the key/value pairs are extracted and displayed. In the cases where a more human readable description is not available (because it isn't known yet), the type of data (Int32Unsigned for example) and the value is still displayed.

Looking at things side by side makes the differences much more apparent.

Phone MTP differences


Storage MTP differences


Folder MTP differences


Windows backup

Another interesting and new thing added to this release is the ability to see Windows Backup and Restore activity in shellbags.

Below is the interface for interacting with Windows backups

After clicking the Restore my files button, a new dialog is shown that allows for picking which backup set to restore from, as shown below.


After selecting a backup date, the user can browse the directory structure. In the image below, I have navigated to my profile directory and selected the Videos folder to add to the restore job.


After the Add folder button is selected, the restore would proceed.

The interesting thing with this activity is that the actions of navigating the backup get persisted in shellbags!

The screen shot below shows what ShellBags Explorer reveals about this activity. As you can see, several timestamps are visible at the different levels. These folders were not necessarily restored, but rather, navigated inside the backup set.


Version 0.9.0.0 is available at the usual location and the Chocolatey package is submitted for approval.

Enjoy!

Windows 10 Creators update vs shimcache parsers: Fight!!

$
0
0

So it seems Microsoft has tweaked the format of AppCompatCache, aka shimcache, yet again with the latest release (or soon to be released) of Windows 10 (Creators update).

Here is an example of what ControlSet001\Control\Session Manager\AppCompatCache looked like on Windows 10 prior to Creators update:


And this is what it looks like in Creators update:


As you can see, the signature/offset to the start of records has changed from 0x30 to 0x34 and the initial record (signature 10ts) has now been shifted 4 bytes from where it used to be.

This pretty much breaks all AppCompatCache parsers:

Registry Explorer plugin failure:


AppCompatCacheParser failure:


Mandiant ShimCacheParser failure:


An issue was filed here about this issue, so it shouldn't be long before ShimCacheParser gets updated.

Updating AppCompatCacheParser


After noticing this difference, I extracted out a SYSTEM hive from Creators update, added a new unit test, and wrote some new code.

The result?


Repeating our test from above with AppCompcatCacheParser, we now get:


AppCompatCacheParser has been updated to 0.9.7.0 and is now available in the usual place. An updated Chocolatey package is also under review.

Enjoy!

Introducing Timeline Explorer v0.4.0.0

$
0
0

Timeline Explorer is a program that started out as a means to view mactime and Plaso generated CSV timelines without the need to use Excel. From these two formats, it has expanded into a tool that supports a wide variety of file formats generated by forensic tools in addition to any random CSV or Excel file you may run across.

Note: Timeline Explorer is not meant to open very large files. It is best to open smaller, targeted timelines than one giant one.

It supports opening more than one document at a time, allows for conditional coloring, filtering and grouping, and much more.

For many files, Timeline Explorer is much faster at both opening and interacting with the data contained therein.

The interface is very simple:


The File menu contains the following options:

Open: Select one or more file to open
Export | Excel: Exports the active tab and view to Excel. What you see is what will be exported
Exit: Quits the program

The Tools menu contains the following options:

Show Details: Displays a dedicated form to inspect all data available in a Plaso generated timeline
Adjust font size: Changes the font size for the main grid
Options | Filter rows on Find: Controls whether or not data is filtered out or simply highlighted when using the Find feature

The Help menu contains the following options:

Quick help: Displays an overview of Timeline Explorer and how to use it
Legend: Contains the color codes used in mactime and super timelines for various types of artifacts
About: Contains information about the program version and contact info

Here is what Quick Help looks like:


The Legend looks like this:


Supported file formats

Timeline Explorer has built-in support for the following file formats and programs:

AmcacheParser Files and Programs
AnalyzeMft
AppCompatcacheParser
Autoruns
JLECmd
LECmd
Mactime timelines
PECmd
SBECmd
ShimcacheMemory
ShimcacheParser
Plaso super timelines

As mentioned above, TLE can also import any CSV or Excel file (first workbook only). The difference between the dynamically imported files and a supported file is TLE's ability to massage the data (combining the Date and Time columns into a single timestamp is one such example).

Below are several examples of timelines that illustrate the conditional coloring capabilities of TLE. These colors correspond to the categories as outlined in the Legend.


Here is a Plaso timeline:


In this final example, the Color column has been used to group rows. The Color column is hidden by default, but right-clicking on any column header and selecting Column Chooser will bring up a means to add any hidden column to the interface.

Once the Color column was unhidden, it was dragged into the group by area at the top of the grid. 

Using this technique allows you to quickly view different artifacts that fall into a specific category.


Diving into super timeline data

One of the drawbacks of super timelines is the sheer amount of information they can contain. For most forensic artifacts, it is difficult to represent hierarchical data in a horizontal fashion. 

When we do this and then try to interact with it, we can end up with something as seen below:


Notice here the tooltip contains a wealth of information that is contained on a single line. If we select that cell and use CTRL-C to copy it to the clipboard, then paste it into a text editor, we can see the details a bit more clearly:


Even in this scenario, the data is not very clean in that there are tab and linefeed characters throughout. While we can certainly do a find and replace on those, that would be impractical in the long term.

TLE solves this problem by making all the data available in a super timeline visible (regardless of whether a column visibility in the main grid). It does this via the Details form which is available from the Tools menu. It can also be shown via the CTRL-D shortcut or by simply double-clicking a row.


Once the Details view is populated, the data is normalized by replacing the special characters to make the data much easier to read.

There are several options available on the Details form including the ability to keep it on top of the main window. This is useful if you want to navigate data in the grid by clicking on the grid and using the arrow keys to navigate. Of course, with multiple monitors or higher resolutions, this becomes less of an issue. There are also two buttons in the lower right that allow for navigating entries.

At the top of the Details window, the currently selected Line number is shown. The active row in the grid is indicated by a triangle in the far left column.

Other capabilities

Once a document is opened, TLE allows for searching, filtering, and grouping. TLE knows when a column contains a timestamp, and when it finds one, it applies a common datetime format (yyyy-MM-dd HH:mm:ss) to these columns. Because TLE knows the columns contain timestamps, it allows for powerful filtering as shown in the examples below.

Like all other columns, the filter is invoked via the funnel icon in the upper right corner of a column.

The Values tab contains a granular way to filter based on timestamps:


The Date Filters tab allows for quickly filtering based on specific time periods:


Searching

To search, press CTRL-F or select the option via the context menu available by right-clicking on any column header.

Once the Find panel is visible, enter in search criteria and any matching text will be highlighted.

Notice in the example below, the total rows is the same as the visible rows. 


Recall there is an option that controls whether rows not containing the search term are filtered out.


If this option is enabled and we do the same search again, notice what happens:


Here we can see the rows that didn't contain our search term are now filtered out.

Tagging

All natively supported formats include the ability to tag rows via CTRL-T. This shortcut will tag or untag a row depending on its current state.

To tag, select one or more rows, then press CTRL-T. A checkbox will indicate tagged rows as seen below.


Because the tag status is maintained in its own row, we can filter for tagged rows. Let's say during the course of a review, several rows of interest were found by the investigator and tagged. This slice of the timeline can then be exported to Excel.

To do this, we first filter for tagged rows via the Tag column's filter, then Export via the File menu.


The data in the grid will be exported exactly as it is shown. This allows you to hide or reorder columns and so on and have the exact representation of data available to you in the Excel document TLE will generate.

Below is an example of what the data from above looks like in Excel.


Dynamic mode

 Below is a random Excel file (you know this because the column names say so...) as seen in Excel:


When this file is imported into TLE, we get this:


A CSV example is next. First, let's take a look at our source document:


Once imported into TLE, it looks like this:


Once a document is dynamically imported, all of the searching, filtering, and grouping capabilities of TLE can be leveraged against the data.


I hope you find Timeline Explorer interesting. If you have any file formats you would like to be natively supported in Timeline Explorer, please let me know.

You can get Timeline Explorer in the usual place as well as Chocolatey.


Timeline Explorer 0.5.0.0 released

$
0
0
Some user requested changes in this version.

Changelog:

NEW: Add Tools | Go to line # to quickly jump to a given line
NEW: Can tag rows via clicking on Tag cell vs needing to use shortcut
NEW: Added an incremental search box to top of main form. Use buttons to navigate results (CTRL-Left and CTRL-Right also navigate search results)

FIX: Remove tab for files TLE couldn't load

Incremental search

Here we see the new incremental search box which allows you to find a string and then navigate to each hit via the arrow keys in the search box or by using CTRL-Left and CTRL-Right arrows to select the previous or next hit in the list.


The currently selected hit is shown with a green background.

Other changes

You can tag rows by clicking on the Tag box vs having to use a hot key.

The Go to line # hotkey allows for jumping to a specific line number in the file:


and once you hit OK, you are magically transported to that row:


Get the update here or Chocolatey.


Registry Explorer v0.9.0.0 released!

$
0
0
This is a big release with a lot of cool new stuff including both features and new plugins.

Overall, the changes look like this:

NEW: Added Raw Value property to non-RegBinary values that contains the bytes that make up the value. This is useful for copying out into other programs like DCode, etc.
NEW: Plugins added for Known networks (SOFTWARE\Microsoft\Windows NT\CurrentVersion\NetworkList), WordWheelQuery, TypedURLs (including TypedURLsTime), Services, Terminal services client (RDP history), DHCPNetworkHint,
NEW: Added Options | Convert selected | To ROT-13 in Find window. This allows for searching for things ROT-13 encoded like UserAssist, etc without having to rely on a plugin
NEW: Added '# subkeys' column to Registry Hives and Available bookmarks trees
NEW: Added 'Selected hive' to left side of the status bar that tracks the name of the hive currently selected. Double clicking copies full path of hive to clipboard
NEW: More bookmarks
NEW: Add indicator for 'Deleted' in search results
NEW: Added 'Data interpreter' option to Values context menu. This allows you to view and decode the raw value data in a wide variety of formats (integer to EPOCH date, etc.)
NEW: Much better filtering options in trees and grid including Excel-like filtering
NEW: Updated controls
NEW: Holding CTRL while right-clicking a node in Registry hives tree will automatically expand all child nodes (saves time over using context menu)
NEW: Project support added. You can now create projects based on currently loaded hives and reload projects as needed
NEW: Add File | Unload all hives option
NEW: More data interpreter conversions

CHANGE: Allow for cell selection vs entire rows in Values grid
CHANGE: Allow for scrollbar on tree so all columns can be seen
CHANGE: User-created bookmarks now show up in the Available bookmarks tab in Blue (bold) font to differentiate them from Common bookmarks
CHANGE: Absolute path to active Registry hive is now prepended to Key path on Copy via context menu in trees and to Value summary in Values grid
CHANGE: Add group membership and password hints to SAM plugin

FIX: Plugins updated based on test data
FIX: Save Datetime format and load it on subsequent starts
FIX: Bug fixes

Plugins (both new and updated)

Registry Explorer is now shipping with 22 plugins.

Updated plugins in this release include the SAM plugin (added group membership and password hints).

New plugins include DHCPNetworkHint, KnownNetworks, Services, TerminalServerClient, TypedURLs, and WordWheelQuery.

Let's take a look at what these can do for us.

DHCPNetworkHint

This plugin deals with keys and values underneath ControlSet00X\Services\Tcpip\Parameters\Interfaces\ and the idea is to pull relevant information into one place.

This is what a typical key and its values look like:


and the plugin turns all the keys and values into this:


Here we see all the network hints deobfuscated, IP addresses, domain information, and lease timestamps.

KnownNetworks

This one is somewhat related to the last one, but the data, of course, lives in a different hive and key. Here is an example of what a key and its values might look like:


The plugin, however, turns all that, into this:


It should be noted that the First and Last connect timestamps are in LOCAL time.

Services

This plugin iterates all the keys and subkeys underneath ControlSet00X\Services and pulls information the from the service key itself as well as the Parameters subkey.


TerminalServerClient

This key is found at 
Software\Microsoft\Terminal Server Client\ and contains several subkeys that contain hostnames, usernames, and MRU lists. Results look like this:

In cases where the host does not have an MRU value, its position is indicated as -1.


TypedURLs

This plugin pulls together information from two keys, shown below:


The TypedURLsTime key contains values which are all 64-bit FILETIME timestamps.

The information is blended together to produce this:


Notice that the URL itself along with anything in slack space is also presented. As these values get reused, slack space can contain previous entries (or parts of them).


WordWheelQuery

This key and subkeys hold search terms. Here is an example of what the key may look like:


And here is what we get from the plugin. Notice both the main key and the subkey have been processed:


Hopefully, you find the plugins helpful! If you have any ideas for new plugins, please let me know!!


Other changes

Raw value added to Type viewer

This allows for copying out the bytes into other tools, reports, etc. The initial need for this feature was to be able to copy bytes out into tools like DCode and whatnot for timestamp conversions, but with the next change we talk about, this will become less necessary.


Data interpreter available for any value

Here we see an example of a 128-bit timestamp found in the NetworkList in a SOFTWARE hive:


Now, in this case, we have a plugin that will do all the heavy lifting for us, but what if that wasn't the case? 

There is now a new option to the Values context menu:


When this option is selected, the Data interpreter is shown for the selected value's raw data:


From here you can see how the raw value converts to a wide variety of formats. This release sees a few new options in the Data interpreter as well (From Base64 and the 128-bit timestamp).


Excel-like filtering throughout

This is one of the neatest features from a usability perspective.

While the default in previous versions was for column filters to be in "Contains" mode, this release makes it much more obvious and allows you to change the filter to a wide variety of options as shown below.


This works for string and number columns.

Timestamp columns also get vastly improved filtering. For example, consider you had a case where some activity occurred in August of 2013 and you wanted to see every key that was changed in that span of time.

You have already loaded several hives of interesting into Registry Explorer.


Bringing up the filter for the Last write timestamp column shows us several options. The first looks like this:


But if we click the Values tab in the filter, we get this:


Since our interesting time frame was August of 2013, if we check that box, like this:


All hives loaded into Registry Explorer are recursively expanded and any keys not matching the selected criteria disappear! We are then left with this view:


Notice that we DO see some keys with a last write time that is outside the window we specified, but these keys are necessary to display in order to maintain the hierarchical relationship between keys and subkeys.

Recall though, there exists an option in the Tools menu, Show parent keys when filtering, that we can toggle to remove the placeholder keys.


With that option toggled off, we are left with this:


So no matter which way you prefer to review your data, the choice is yours!


Project support

The File menu now has a Project menu that allows for saving all of the currently loaded hives in Registry Explorer to a file (*.re_proj) that can then later be used to load the same hives much quicker the next time you need to look at them.


There is also another new option in the File menu to unload all hives. This makes restarting Registry Explorer or closing each loaded hive manually unnecessary anymore.


Available bookmarks changes

This release also makes it easier to differentiate between Common (included) bookmarks and user-created bookmarks.

Here we see some Usrclass.dat hives loaded into Registry Explorer. Notice we have 1/0 for bookmarks in the menu.


If I add a few bookmarks for various keys against Usrclass.dat hives and then go back to the Available bookmarks tab, things look slightly different:


Any bookmarks in the User folder will be highlighted in blue to make it easier to see both kinds of bookmarks.

This allows you to move bookmarks in and out of both the Common and User directories under the Bookmarks folder so that you can hone in on things easier. For example, rather than wade through 25 bookmarks that are usually in the Common folder, move the ones most relevant to you to the User folder and they will show up in blue.

Find changes

A column indicating whether or not the search hit was found in a deleted (and recovered/reassociated ) key/value was added:


The Options menu also got a new addition, Convert selected | To ROT-13, which is useful for finding encoded data (in UserAssist for example).

While Registry Explorer has a plugin to decode UserAssist keys, if you had the name of an executable you wanted to search for and aren't sure if it exists, you can convert it to ROT-13 and search that way.

For example, consider a case where you suspect the use of the sc.exe tool. You are looking at user's NTUSER.DAT hives and do a search for sc.exe, but it comes up empty:


First, select the search term to encode, then use the To ROT-13 option:


When we do a search now, we get this:


which is a hit in one of the UserAssist keys. If we double click the hit, we jump to that value:


We can then verify these hits by either manually reversing ROT-13 or just looking at the UserAssist plugin output:


Either way, you have your hit!


You can find the update in the usual places and the Chocolatey package should be updated soon too.


Please do not forget that I am up for the Forensic 4cast awards in the Digital Forensic Investigator of the Year category. 

If you would not mind, please vote for me!

https://forensic4cast.com/forensic-4cast-awards/


ShellBags Explorer 0.9.5.0 released!

$
0
0
Changes in this version include:

NEW: Additional GUIDs added
NEW: Several new Shellbag types and extension blocks added
NEW: SBECmd.exe can now process the live registry on the system it runs on via the -l switch
CHANGE: SBECmd.exe now looks recursively for ntuser.dat and usrclass.dat files in the directory specified (Previously it only looked in the directory specified)


Most of the changes are under the hood in the GUI, but there are several changes made to SBECmd.exe. Let's take a look at these a bit closer

Reading ShellBags from a live system

A new switch, -l (lower case L), tells SBECmd to process the live registry vs an offline hive. With this change, you must specify either -l or -d (but not both obviously).

Here is an example:


The name of the export file is based off the timestamp when SBECmd was executed as well as the machine name it was run on.


Recursive processing of directories

In previous versions, SBECmd only looked at the directory specified via the -d switch for hives. This version changes that so that all directories are searched recursively for hives that contain shellbags.

Let's say you used X-Ways to filter for all ntuser.dat and usrclass.dat files in a case. You then export those files out and use the option to recreate the original path and end up with something like this:


The -d switch, when passed the value of 'c:\temp\ntfs' would then find all the hives and process them, saving out one tsv file per hive. The results would look something like this:


The full path to the hive is used for the output file so you can easily reference back to the hive where it came from.

These tsv files can now be ingested into your tool of choice for further processing.

Thanks to David Cowen for the live registry processing request! Someone else requested the recursive feature and I tried to find that request to give credit but I could not find it. Thank you too!

You can get the update at the usual spots: https://ericzimmerman.github.io/ and Chocolatey


(Am)cache still rules everything around me (part 2 of 1)

$
0
0

Salutations!

It seems in recent versions of Windows 10 (i.e. those in the fast ring as of the last few weeks) has introduced some changes to artifacts, similar to what was done with appcompatcache back in March of this year. These changes will become finalized in the Windows 10 Fall Creators update, which is due to be released on October 17, 2017. It is unknown at this time if any of the changes I am soon to discuss will be backported into any previous versions of Windows (10 or otherwise).

Before we begin, it would be helpful to understand the current workings of amcache. For those not familiar with it, see my original blog post here as well as the webinar I did here.

The changes in the latest builds of Windows takes away some things and adds some things. As we will see, we are getting far more than we are losing (always a good thing).

Many thanks go to the DFIR Oracle, Troy Larson, who pointed out the change. Without him, we would be lost.

AmcacheParser has been updated to support this new format. It automatically detects the format and parses things accordingly, as seen below:


Let's take a closer look at how things have changed in this new version.

Note" Any tool that has been parsing amcache.hve will break when used on these new formats as the old keys and value names no longer exist.

What stayed the same?

In general, we still have a listing of files and a listing of applications. The key names and paths have changed, along with the value names.

Programs, now known as Applications, live at "Root\InventoryApplication".
Files live at "Root\InventoryApplicationFile".

What do we lose?

The old format had a key for each program that tracked a (generally accurate) list of all the files associated with said program. This list is gone in in the new format.

The volume information for each file entry is gone, but this was mostly useless as each file entry stored the full path to the executable.

Unfortunately, MFT information has been removed from the File entries =(

What do we gain?

On average, there are more values associated with a file entry. The new format consistently has 17 values whereas the old version had 4-5 values on average.

Program entries, now known as Applications, gain a value and are consistently showing 21 values in a given key (vs the 17-20 on average for the old format)

The other nice thing across the board is that the value names are much more meaningful. In the old format, value names were more or less numerical. but in the new version, they are descriptive.

For example, in the old format, the SHA-1 was kept in a value named "101" but now that same value is kept in a value named "FileId".

Other very interesting fields include such things as:

  • IsOSComponent
  • LinkDate
  • IsPeFile
  • BinaryType (32 or 64 bit)
  • Install Date
  • DriverIsKernelMode

Is there anything new?

I am glad you asked! There is a ton of new and awesome detail in the new format. There are now keys and subkeys that track:
  • Application shortcuts
  • Device containers
  • Device interfaces
  • Device PnP information
  • Device driver binary information
  • Device driver package information

We will cover many of these in dedicated sections below.

Shortcuts

Shortcuts live under the "Root\InventoryApplicationShortcut" key. The subkeys contain information about the target of the lnk file (it is often truncated) along with an unknown identifier. Here is an example:


Each subkey contains a single value to a shortcut.

What is interesting is some of these shortcuts were not created by an MSI or installer. The X-Ways shortcuts were placed there by XWFIM, which is programmatically creating lnk files. 

This data, when exported by AmcacheParser, looks like this:


Device containers

Device containers track things like bluetooth, printers, audio, storage, and so on. These are found under the key "Root\InventoryDeviceContainer". 

An example of what one looks like is shown below. Notice in this example, the "Categories" value references bluetooth.


These subkey names are also referenced in the DevicePnP section (discussed more below) via the "ContainerId" value and can be used to group Devices back to a container. For example, in the image below, I searched for the subkey shown in orange above and it was found in several subkeys under the DevicePnP section. Notice each of the PnP entries relates to "bluetooth"


If we take a look at the last entry in the search results, it looks like this:


This data, when exported by AmcacheParser, looks like this:


PnP information

As we touched on above, there is also a dedicated bucket for PnP devices, found under "Root\InventoryDevicePnp" that looks like this:


The unique device classes seen in my sample data include:

  • system
  • processor
  • bluetooth
  • net
  • monitor
  • media
  • hidclass
  • battery
  • keyboard
  • mouse
  • display
  • hdc
  • usb
  • scsiadapter
  • computer
  • image
  • cdrom
  • diskdrive
  • volume
  • softwaredevice
  • wsdprintdevice
  • audioendpoint
  • printqueue
  • printer
  • firmware
  • ComputerHardwareId

There is a lot of other interesting data here including driver dates, provider, version numbers, and more.

This data, when exported by AmcacheParser, looks like this (partial list):


Driver binary information

Binary driver information lives in a key named "Root\InventoryDriverBinary".  There are subkeys that refer to the full path of a driver. Each key has 18 values in it that looks like this:


Some very interesting value names can be seen here, including DriverInBox, DriverIsKernelMode, and the two timestamps. You can also see information on whether the driver is signed, what service it is associated with, and so on. There are lots of uses for this kind of information on a wide variety of cases!

This data, when exported by AmcacheParser, looks like this:


Driver package information

Finally, we have driver package information that lives under "Root\InventoryDriverPackage". There are subkeys containing information related to inf files and some other identifier. 

The subkey name ties into several other buckets of data such as:
  • DevicePnP via the DriverPackageStrongName value
  • DriverBinary via the DriverPackageStrongName value
  • ApplicationFile via the LowerCaseLongPath value
Here is an example:


This data, when exported by AmcacheParser, looks like this:


Wrapup

Whew! There is a lot of awesome new information in amcache.hve and this release is just the beginning of making it usable. A future version will do more to tie the information in the different high-level keys together (driver packages to PnP, etc.)

Needless to say, there is a lot of new research to be done! I hope people find this update useful and find all sorts of interesting new ways to use the data in DFIR work! If you figure out something cool, please let me know so I can add it to AmcacheParser.

As was mentioned at the beginning of the post, AmcacheParser is updated and can handle these new hives (and almost a full 2 weeks before it hits the wild too!)

Get it here or here.


Timeline Explorer 0.6.0 released!

$
0
0
The changelog for this version includes:

NEW: More file formats (pescan, sigcheck, density scout, all new AmacacheParser formats)
NEW: When editing filters, you can customize via text (vs clicking thru options, adding OR, etc)
NEW: Ability to change the date time format
NEW: Ability to save and load sessions
NEW: Ability to pin columns to left side of window so they do not scroll out of view
NEW: Added "Reset column widths" option in case columns get crazy wide. this will resize any columns > 250 wide down to 250

CHANGE: Made the filter buttons bigger
CHANGE: Remove CTRL-F to bring up find window (use search box instead)
CHANGE: Updated controls

FIX: Some general fixes


Updated controls and parsers

This version includes newer versions of the grid as well as the back end CSV parser. One of the changes in the CSV parser includes "Massive speed improvements" which is always a nice thing.

New options

The new menu items look like this:


You can now save and reload session data for all files loaded in TLE.


The tools menu adds two new options, one to control the timestamp format and the other to reset column widths when they get out of hand. This generally happens in super timelines when expanding the Long Description column too far.

When changing the timestamp format, be sure to adjust it BEFORE loading a file.

Improved filter editing

When editing filters, you can now optionally use text mode which can be faster than adding new conditions with the mouse.

It has IntelliSense support and will autocomplete available columns and filter conditions, etc.


Column pinning

When loading "wide" files with a lot of columns, it is often helpful to always keep certain columns in view. This version of TLE adds the ability to pin columns to the left of the window so the columns always remain in view. You can, of course, clear this via the little button to the right of the option.


Here is a video showing what this looks like on a super timeline. Notice that without column pinning, as soon as the Long Description column filter is selected, all the columns to the left of the Description column go out of view. Once some columns are pinned, they remain in view. The video also shows the new filter editing too.


If there is a file format you want added to TLE, just send me a sample!

Get the update in the usual places!

Introducing SDB Explorer

$
0
0
This is the initial release of SDB Explorer.

SDB Explorer is a GUI program that allows for interacting with Microsoft Shim databases. For more details on what kind of data is contained in these types of files, go here and here and here.

If you have used any of my other programs, usage of SDB Explorer will be familiar.

Getting started

Let's start by taking a look at the main interface. On the left, a tree view will be populated with data from the SDB file. As a node in the tree is selected, the text area in the upper right will be populated with details about the selected node as well as all child nodes. This will be shown in more detail below. When looking at binary keys, the contents are displayed in the hex viewer in the lower right. There is also a data interpreter available in the hex viewer.


To load a file, use the File menu, or press ALT-1.


Once a file is loaded, the tree us updated and the status bar reflects the full path as well as the version of the database.

There will be three collections in the tree: INDEXES, DATABASE, and STRINGTABLE. Most people will spend their time in the DATABASE section as this is where the majority of the data is located.

Each node also contains the offset where the data displayed in a node can be found in the original file.

Selecting a node in the tree will update the textbox, as shown below. The textbox contains all the data from the selected node down.

In the example below, the Database node is selected. Notice how every child node's details are pulled into the text box and indented according the level they are found in the database heirarchy.


Selecting a different node updates the text box. Notice here we see everything from the PATCH tag down.


You may have noticed that one of the keys, PATCH_BITS, shows a value of (Binary data). If we click on this tag, notice what happens to the interface.


PATCH_BITS tags contain one or more sub items, which SDB Explorer automatically pulls out and decodes. In the example above, we have just a single item. Selecting it displays relevant information as shown below:


 In some cases, there are multiple items. When this happens, more sub items are listed:


Should you need one, the hex viewer contains a data interpreter as well.


You can also select bytes and copy them out in several formats:


Finding and filtering nodes

The tree can filter nodes via the column headers. For example, entering '.exe' into the Name column results in this being displayed:


When filtering, if you select a node, the text is updated TO ONLY INCLUDE VISIBLE NODES. This allows you to filter for what is important for you and then copy the details out.


 Compare that to what we see if we do NOT have a filter in place and select the DATABASE item.


The Info menu allows you to see the distribution of tags in a given database. For larger databases, you may need to make the Metrics window bigger (or just maximize it) to see all the data.


Finally, you can dump all the strings to a text file via the File menu . This is similar to clicking on the STRINGTABLE item and selecting the text, but when dumping strings, only the strings are extracted (i.e. they are not prefixed with 'STRINGTABLE_ITEM')

Navigating around tags

Lets take a look at a more specific and useful example, a FIN7 SDB file, as discussed here.

In SDB Explorer, a database related to FIN7 looks like this:


Notice there is a tag named PATCH_REF right above STRINGTABLE. One of the child items of that tag is another tag named PATCH_TAGID which has a value of 0x60. TAGIDs point to another tag in the DATABASE and the value is the offset to where the actual data lives.

Since we have a value of 0x60, we have to look for a PATCH tag with an offset of 0x60, which we see below.


Now that we are at the correct offset, we can interact with the PATCH tag and dig into it using the same methods we already discussed above (viewing PATCH_BITS and its sub items, etc).

If you have any ideas, suggestions, etc. please let me know and I will be happy to add them!

You can get SDB Explorer at the usual place.


Enjoy!!!

Updates to the left of me, updates to the right of me, version 1 releases are here (for the most part)

$
0
0
Yay for version 1 releases! With Registry Explorer's v1.0 release and its underlying support of replaying transaction LOG files, it was only appropriate for my other Registry based tools to also be updated to support LOG files as well.

The following is a summary of what has been released:
  • Registry Explorer v1.01
  • RECmd v1.0
  • ShellBags Explorer v1.0
  • AppCompatCacheParser v1.0
  • AmcacheParser v1.0
  • Timeline Explorer v0.8.0.0

So what has changed?

This is a minor update for Registry Explorer that adds the ability to see the Access Flags in newer hives on the Technical details view:


For everything else (except Timeline Explorer), the biggest change is detecting when a hive being processed is dirty and, if the LOG files are found in the same directory as the hive, replaying the LOG files before proceeding. If the LOG files are missing, the tool will complain and not process the hive.

Here is an example of what the updated tools might look like:

In this case, the Amcache.hve file is in D:\temp, but no LOG files are present. Because the hive is dirty and no LOGs were found, the parser bails:


In this case, the LOG files are in the same directory, so the parser replays them over the hive, then proceeds:


It should be noted that ALL the tools (except for Registry Explorer) expect the LOG files to be named the same as the hive, but end in either .LOG1 or .LOG2. So, for example, if you had a hive named:

EricNtuser.dat

The tools would expect the logs to be named:

EricNtuser.dat.LOG1 and EricNtuser.dat.LOG2

Keep this in mind when exporting multiple hives to the same folder.


The exception mentioned above is Registry Explorer, which will detect and walk you through applying the transaction logs, like this:


In addition to Registry transaction log support, all the tools have also had any 3rd party components and controls updated to the latest versions as well.

Timeline Explorer changes

The changes for Timeline Explorer (TLE) are rather significant and deserve some detail.

The changes in v8.0.0.0 include:

  • NEW: For text columns, introduce a 750ms delay when typing a filter before actually trying to filter the data. This makes filtering MUCH smoother for large data sets.
  • NEW: Added Power filter, which allows for complicated filters across all columns including negation, logical AND, etc.
  • FIX: Correct issue when a filter is in place and then the search dialog is used (the first hit would always be reselected after navigating to previous or next hits prior to this fix) 

The first new feature is pretty straightforward. In previous versions, column filters would be updated immediately as new information was typed in the filter row. This often led to laggy performance when a file with hundreds of thousands of rows is loaded. By adding the delay, the interface is updated much less often and remains responsive.

The second new filter is very exciting and opens up a TON of new functionality to really drill down into the specifics of your data.

In the example below, two files are loaded into TLE. Notice that Search has been relabled Find in this version and a new feature, the Power filter, sits below it.

The Find option will, for the term entered in the box, highlight the term anywhere it is found in the data. No filtering is done on the data when using Find.

The Power filter on the other hand, DOES filter out data and allows for very powerful filters to be created. In the screen shot below, notice the button indicated by the arrow. Clicking this will bring up the Power filter's help dialog.


Here we can see the different functionality we can use with the Power filter. Notice that you can do logical ANDs, negation, searching in specific columns, and so on.


Another very nice use of the Power filter is searching for an exact timestamp. To do this, put the entire timestamp in double quotes, like this:


Of course, you do not have to do an entire timestamp:


Recall however, that the Power filter allows for combining terms in a lot of different ways, so how does that work? Let's take a look at an example:

Here we can see we have a supertimeline loaded:


Let's say were interested in, oh, I don't know, a user successfully logging onto this computer. We use the Power filter and enter '4624' into the box


Notice that all rows that do not contain the search term have been filtered out. Additionally, notice that Line 542 is selected (the little black arrow on the left is the selected row indicator). The details for this row look like this:


While there is a wealth of information on the screen, let's say you had zero interest in when tdungan logged in. As such, it would be nice to get rid of anything that contains 'tdungan'. To accomplish this, we would do something like this:


And we can see that we have less rows visible as a result (418 rows, down from 426).

If you then had a need to find only 4624 events that didnt contain tdungan but do contain IP address 10.3.58.7, we could do something like this:


And we have really dropped our row count down (to 78 in this case).

Of course the data does not have to all be in the same column. Perhaps you are only interested in these kinds of things on a certain date:


Of course, this is just the tip of the iceberg for what is possible to build.

The Power filter remembers all the filters on a per tab basis (but only for the current session). Clicking the drop down arrow to the right of the Power filter shows you previously used filters:


Of course do not forget about column pinning as this can make your life a lot easier for wide data sets:


You can get the updated software at the usual place and the Chocolatey packages have also been updated.

Enjoy!!


Introducing WxTCmd!

$
0
0
WxTCmd is a parser for the new Windows 10 Timeline feature database.

We have been hearing about it for several weeks now, but with 1803 finally final, I had a chance to update my system and let the feature do its thing.

See here and here for more details on the database. I initially perused that site and then dug into the database format manually to see what else I could find in there.

This database lives under a user's profile:

C:\Users\<profile>\AppData\Local\ConnectedDevicesPlatform\L.<profile>\ActivitiesCache.db

This utility can be run on a live system or after extracting the ActivitiesCache.db file from a forensic image, etc.

Usage is very simple:


Right now, two tables are being processed as these are the only two tables the contain data on my systems.

Once the data is extracted, we end up with tsv files that can be dropped into Timeline Explorer v0.8.1.1 or later (which was released to support these new file types).

From a data perspective, the Activities table contains fields that contain json strings, timestamps (in epoch format) such as start time, end time, last modified time, etc, and other various identifiers including executable names and file names that applications opened.

The Activity_PackageId table contains much less information but it too can contain executable names.

In both tables, the executables are often recorded with a GUID vs an absolute path. With the work previously done in ShellBags Explorer, I just happen to have a list of 100s of GUIDs to human names, so I resolve these when processing things as well.

For executable names, it seems to be tracking Windows Universal apps using a certain identifier, win32 apps using another, etc. All of this detail is processed and the relevant strings extracted and normalized, including URLDecoding contentURIs and whatnot.

The end result looks like this when dropped into TLE.

Activity_PackageId is first.


Here we can see the GUID resolution in action.

Finally, the Activity information contains the most detail:


This one has a lot going on, so let's talk about it.

In most cases, the Display Text and Content Info fields are not populated. When they are however, you can see we get a lot of nice detail including the name of the file and its full path. This information isn't sitting as is in the database, but I process the json and extract things out as needed.

I had TLE sorted by Display Text in the screen shot above, but you can see how sorting on Start Time would be beneficial.

Scrolling right, we can see these columns:


Notice all those nice timestamps! Again, these are stored in the database as an integer, but WxTCmd changes them all to DateTime objects.

It should be noted that I have not seen the End Time timestamp being populated for application usage (i.e. Excel was running for 22 minutes and 8 seconds, etc.) where file names are also retained, but other entries DO show a nice start and end time. In these cases, I calculate the duration, like this:


Notice in this example calculator has been tracked as running for over 2 days (what can I say, I like to add things up).

This is a very new artifact and this tool will certainly be getting updates as we figure out more and more about what it is tracking.

Try it out and let me know what you think!!


The main download site and Chocolatey have been updated with the new releases, but Chocolatey may take a while for the package to show up since its new.
Viewing all 76 articles
Browse latest View live